HOT TOPICS LIST
- MACD
- Fibonacci
- RSI
- Gann
- ADXR
- Stochastics
- Volume
- Triangles
- Futures
- Cycles
- Volatility
- ZIGZAG
- MESA
- Retracement
- Aroon
INDICATORS LIST
LIST OF TOPICS
PRINT THIS ARTICLE
by Gary Grosschadl
Early in the year when gold neared the $430 mark, the XAU Gold & Silver Index also peaked at 113. This index has made a classic retracement on their weekly chart as the price of gold also slipped.
Position: Hold
Gary Grosschadl
Independent Canadian equities trader and technical analyst based in Peterborough
Ontario, Canada.
PRINT THIS ARTICLE
CHART ANALYSIS
XAU's (Gold Index) Bold Bounce
06/01/04 01:51:12 PMby Gary Grosschadl
Early in the year when gold neared the $430 mark, the XAU Gold & Silver Index also peaked at 113. This index has made a classic retracement on their weekly chart as the price of gold also slipped.
Position: Hold
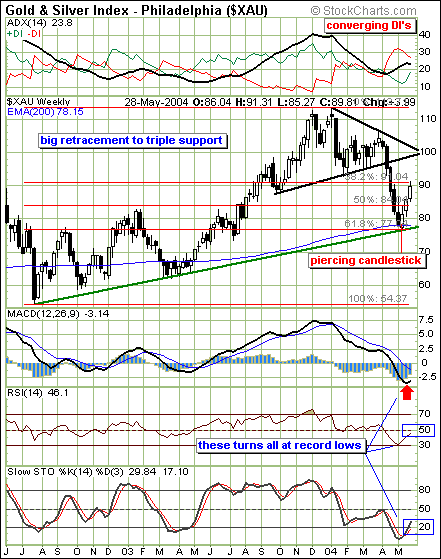
| I refer to a "classic" retracement on this weekly chart for three reasons. The XAU gold index bounced at a strong confluence of support consisting of a multi-year trendline, the 200-period EMA, and a major Fibonacci retracement level of roughly two thirds or 61.8%. When the XAU broke out of its small triangle, the technical trader who asked the question, "Where is the strongest support?" (on the weekly chart) would have nailed the exact turn. Any one of those three possible supports would make a good argument for a possible upturn. The fact that all three formed a confluence of support was a powerful hint of a likely strong bounce. The candlestick reader was also given a strong indication of a sizeable upleg developing with a piercing candle formation. This up candle (coming after sizeable downleg) closed above the midpoint of the previous down candle. This "piercing" configuration is a bullish sign of a reversal attempt. This resulted in two additional weeks of gains as shown. |
| But is there enough juice to keep heading higher? Looking at the chart, two possibilities should be in the forefront. The more obvious one may be a bullish move to challenge the apex of that symmetrical triangle, representing a previous congestion zone. However the other scenario could involve some consolidation at another significant Fibonacci level, the 38.2% retracement point. Looking back, you can also see this served as a previous congestion zone from the fall of 2003. After three weeks of gains as shown by the three powerful candlesticks (similar to a very bullish formation called "three white soldiers"), a brief consolidation could be a reasonable expectation. |

|
| This weekly gold index chart shows a strong retracement bounce. |
| Graphic provided by: Stockcharts.com. |
| |
| The displayed indicators show the promise of a powerful turn in the making, provided that bullish follow-through continues. Starting from the topmost graph, this extra proof takes the form of an actual DI crossover (as part of the directional movement indicator or DMI), a MACD (moving average convergence/divergence) crossover, RSI (relative strength indicator) moving above the often critical level of 50, and a stochastic follow through above the 50 level. Note that the three lower graphs all show turns starting from record low levels from the multi-year time period shown. This often leads to a significant move. |
| In summary, this weekly chart reflects the promise of continued gains but a brief respite or consolidation would not be unusual at this juncture. No doubt world events will be a factor as the underlying gold price fluctuates. The uncertainty of high oil prices, political climate in the Middle East, and the threat of continuing terror are all elements that can move gold prices and indexes. |
Independent Canadian equities trader and technical analyst based in Peterborough
Ontario, Canada.
| Website: | www.whatsonsale.ca/financial.html |
| E-mail address: | gwg7@sympatico.ca |
Click here for more information about our publications!
Comments
Date: 06/03/04Rank: 5Comment:
Date: 06/08/04Rank: 5Comment:
Date: 06/08/04Rank: 5Comment:

Request Information From Our Sponsors
- VectorVest, Inc.
- Executive Premier Workshop
- One-Day Options Course
- OptionsPro
- Retirement Income Workshop
- Sure-Fire Trading Systems (VectorVest, Inc.)
- Trading as a Business Workshop
- VectorVest 7 EOD
- VectorVest 7 RealTime/IntraDay
- VectorVest AutoTester
- VectorVest Educational Services
- VectorVest OnLine
- VectorVest Options Analyzer
- VectorVest ProGraphics v6.0
- VectorVest ProTrader 7
- VectorVest RealTime Derby Tool
- VectorVest Simulator
- VectorVest Variator
- VectorVest Watchdog
- StockCharts.com, Inc.
- Candle Patterns
- Candlestick Charting Explained
- Intermarket Technical Analysis
- John Murphy on Chart Analysis
- John Murphy's Chart Pattern Recognition
- John Murphy's Market Message
- MurphyExplainsMarketAnalysis-Intermarket Analysis
- MurphyExplainsMarketAnalysis-Visual Analysis
- StockCharts.com
- Technical Analysis of the Financial Markets
- The Visual Investor
