HOT TOPICS LIST
- MACD
- Fibonacci
- RSI
- Gann
- ADXR
- Stochastics
- Volume
- Triangles
- Futures
- Cycles
- Volatility
- ZIGZAG
- MESA
- Retracement
- Aroon
INDICATORS LIST
LIST OF TOPICS
PRINT THIS ARTICLE
by Gary Grosschadl
At this point, the Dow is at a crossroads if you happen to spot it.
Position: Hold
Gary Grosschadl
Independent Canadian equities trader and technical analyst based in Peterborough
Ontario, Canada.
PRINT THIS ARTICLE
TRIANGLES
Current Dow Challenge
06/03/04 10:33:56 AMby Gary Grosschadl
At this point, the Dow is at a crossroads if you happen to spot it.
Position: Hold
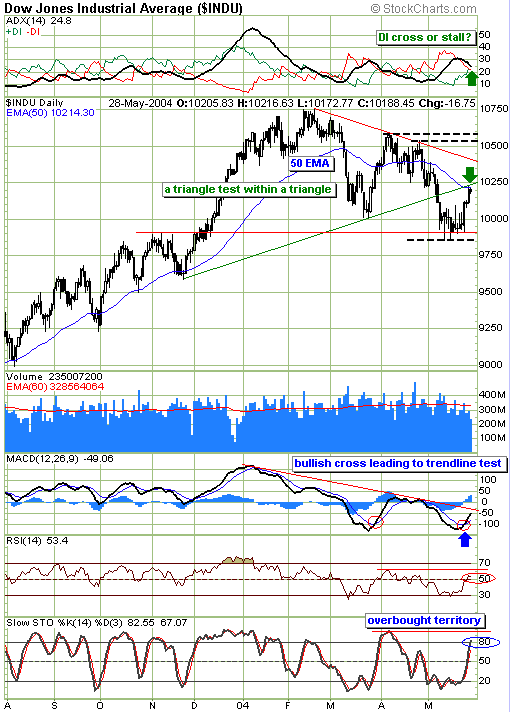
| The most common form of pattern recognition is the triangle. There are several common variations and they often come into play. At times you can see more than one and here is a good illustration. Drawing trendlines with the current upleg enables the chartist to see a descending triangle. The horizontal bottom trendline is anchored by two relevant areas. The first one occurred last November and is represented by the principle of previous resistance turning into future support. This is in the 9900 area. However the previous triangle pattern is still in play. The green trendline shows the lower limit of a previous symmetrical triangle (using the same red upper trendline). When the pattern was violated to the downside, a test of 10,000 ensued which actually turned out to more accurately test that previous resistance zone from last November. As strong as the psychological mark of 10,000 is, the chart actually hinted that last November's high watermark had greater technical significance. |
| The descending triangle looks rather mundane at this point because it is still a ways off either trendline. However, the older symmetrical triangle tells a more compelling story. When patterns break either way, whether to the upside or downside, a retest of the relevent trendline often comes into play in the form of throwbacks and pullbacks to that breakpoint. This is what is happening now with the Dow. Failure here means the original downside move is correct and will come back into play with likely greater downside vigor. This should at least test that last holding area around 9900 once again. Failure there could have more ominous implications, one being a failure of the descending triangle, often considered a bearish pattern in the first place. This has the potential of a sizable decline of several hundred points. |

|
| The daily Dow chart shows a pullback test to a symmetrical triangle. |
| Graphic provided by: Stockcharts.com. |
| |
| Adding relevence to this current triangle test is the location of the 50-day EMA (exponential moving average). It coincides exactly with this green trendline and raises the possibility of this index going into "failure mode" and staying under the moving average, as the moving average becomes a line of resistance. In other words, a bear trend as the 50-period EMA line trends downwards. |
| Several indicators should also be considered as possible clues. The topmost graph shows the various components making up the directional movement indicator (DMI). This indicator shows a crossroads test of its own. Should the DIs cross, then bullish power (+DI) gains the advantage over bearish forces (-DI). However a stall or refusal to cross has bearish implications. The MACD (moving average convergence/divergence) looks promising with its recent bullish cross. But it does need to rise above its own trendline to show more upside conviction. The RSI (relative strength index) also seems to offer mixed blessings with its bullish rise above the 50 level yet hinting at stall danger as well. The stochastics indicator shows the index just starting to edge into overbought territory, with the options of a possible early failure at the 80 level or additional upside room being the question. |
| Should bullish forces prevail, two upside targets or tests are in sight, the first being the upper triangle trendline, followed by the resistance band roughly 10,500 to 10,600. The action in the next few trading sessions should provide telling clues as to which way this closely watched index eventually goes. |
Independent Canadian equities trader and technical analyst based in Peterborough
Ontario, Canada.
| Website: | www.whatsonsale.ca/financial.html |
| E-mail address: | gwg7@sympatico.ca |
Click here for more information about our publications!
Comments
Date: 06/08/04Rank: 5Comment:
Date: 06/12/04Rank: 1Comment: he was dead wrong

Request Information From Our Sponsors
- VectorVest, Inc.
- Executive Premier Workshop
- One-Day Options Course
- OptionsPro
- Retirement Income Workshop
- Sure-Fire Trading Systems (VectorVest, Inc.)
- Trading as a Business Workshop
- VectorVest 7 EOD
- VectorVest 7 RealTime/IntraDay
- VectorVest AutoTester
- VectorVest Educational Services
- VectorVest OnLine
- VectorVest Options Analyzer
- VectorVest ProGraphics v6.0
- VectorVest ProTrader 7
- VectorVest RealTime Derby Tool
- VectorVest Simulator
- VectorVest Variator
- VectorVest Watchdog
- StockCharts.com, Inc.
- Candle Patterns
- Candlestick Charting Explained
- Intermarket Technical Analysis
- John Murphy on Chart Analysis
- John Murphy's Chart Pattern Recognition
- John Murphy's Market Message
- MurphyExplainsMarketAnalysis-Intermarket Analysis
- MurphyExplainsMarketAnalysis-Visual Analysis
- StockCharts.com
- Technical Analysis of the Financial Markets
- The Visual Investor
