HOT TOPICS LIST
- MACD
- Fibonacci
- RSI
- Gann
- ADXR
- Stochastics
- Volume
- Triangles
- Futures
- Cycles
- Volatility
- ZIGZAG
- MESA
- Retracement
- Aroon
INDICATORS LIST
LIST OF TOPICS
PRINT THIS ARTICLE
by Gary Grosschadl
Novell, Inc., (NOVL) a leading provider of information solutions, appears in trouble on this daily chart.
Position: N/A
Gary Grosschadl
Independent Canadian equities trader and technical analyst based in Peterborough
Ontario, Canada.
PRINT THIS ARTICLE
DESCENDING TRIANGLES
Novell Inc. Has Chart Woes
06/02/04 04:14:55 PMby Gary Grosschadl
Novell, Inc., (NOVL) a leading provider of information solutions, appears in trouble on this daily chart.
Position: N/A
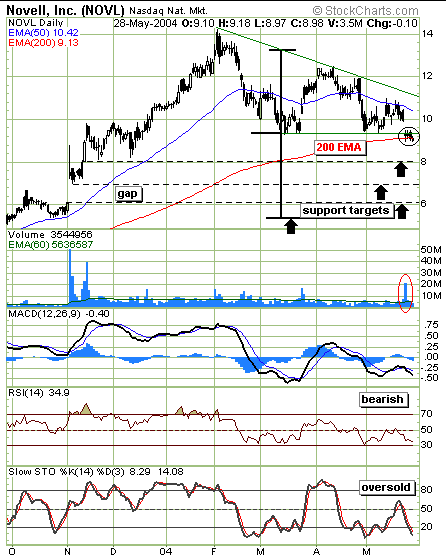
| The NOVL chart shows two major concerns right now. The first is a possible pattern failure and the second is a dangerous dip below a significant moving average. A descending triangle is generally considered a bearish formation and now the pattern has been violated to the downside. The fact that it has not managed a quick bounce back up does not bode well for this high tech stock and it could be attracting short sellers on this weakness. With enough bearishness the pattern completion target should be considered. This does not mean it will go down this far, only that it can when considering a measured move. Applying the distance of the widest applicable part of the triangle to the downside measure below the triangle base, gives the fulfillment target of about $5.50. The other support targets that may come into play are marked by the black arrows. In order, these relate to the base of a previous large candlestick just above $8, the top of a previous gap around $7, and the bottom of the gap just above $6. Any of these may prove to be areas of possible support. |
| The second major concern is that the stock moved below its 200-day exponential moving average. This is often a trigger point for support or resistance, and here it could mean that important longer-term support is failing. A similar example could be the 50-day EMA. All was well when the stock was climbing and this 50-period moving average was comfortably below it. Since the stock first broke below this 50-period EMA last winter, it has spent more time below this line than above it. Now this moving average is acting as overhead resistance and appears to be in "failure mode" with its inability to rise above it. |

|
| NOVL's daily chart is weak. |
| Graphic provided by: Stockcharts.com. |
| |
| Several indicators are considered here. The MACD (moving average convergence/divergence) is well below the zero line and still downsloping, indicating a bearish trend while in a similar fashion the RSI (relative strength index) is below its often important 50-period level. The stochastics indicator is also at low levels but is hinting at an oversold condition. An upturn from below the 20 level is often the first sign of a bounce attempt. The strength or weakness of the next bounce will be a telling sign as a weak bounce attempt will bring more downside danger and those lower targets may then come into play. |
| The bottom line for NOVL may well be that as long as it struggles below its 50-day EMA, the trend is down on this daily view. This recent move below the 200-period EMA compounds the situation as this could accelerate a move to test downside support levels. Any surprise bullish move back above the 50-day EMA should be viewed with some healthy skepticism as the triangle's top trendline again becomes an important level of overhead resistance. |
Independent Canadian equities trader and technical analyst based in Peterborough
Ontario, Canada.
| Website: | www.whatsonsale.ca/financial.html |
| E-mail address: | gwg7@sympatico.ca |
Click here for more information about our publications!
PRINT THIS ARTICLE

Request Information From Our Sponsors
- VectorVest, Inc.
- Executive Premier Workshop
- One-Day Options Course
- OptionsPro
- Retirement Income Workshop
- Sure-Fire Trading Systems (VectorVest, Inc.)
- Trading as a Business Workshop
- VectorVest 7 EOD
- VectorVest 7 RealTime/IntraDay
- VectorVest AutoTester
- VectorVest Educational Services
- VectorVest OnLine
- VectorVest Options Analyzer
- VectorVest ProGraphics v6.0
- VectorVest ProTrader 7
- VectorVest RealTime Derby Tool
- VectorVest Simulator
- VectorVest Variator
- VectorVest Watchdog
- StockCharts.com, Inc.
- Candle Patterns
- Candlestick Charting Explained
- Intermarket Technical Analysis
- John Murphy on Chart Analysis
- John Murphy's Chart Pattern Recognition
- John Murphy's Market Message
- MurphyExplainsMarketAnalysis-Intermarket Analysis
- MurphyExplainsMarketAnalysis-Visual Analysis
- StockCharts.com
- Technical Analysis of the Financial Markets
- The Visual Investor
