HOT TOPICS LIST
- MACD
- Fibonacci
- RSI
- Gann
- ADXR
- Stochastics
- Volume
- Triangles
- Futures
- Cycles
- Volatility
- ZIGZAG
- MESA
- Retracement
- Aroon
INDICATORS LIST
LIST OF TOPICS
PRINT THIS ARTICLE
by Gary Grosschadl
With oil prices in a rising trend, the Airline Index ($XAL) has been taking a beating.
Position: Sell
Gary Grosschadl
Independent Canadian equities trader and technical analyst based in Peterborough
Ontario, Canada.
PRINT THIS ARTICLE
DESCENDING TRIANGLES
Airline Index Losing Altitude
06/01/04 09:11:57 AMby Gary Grosschadl
With oil prices in a rising trend, the Airline Index ($XAL) has been taking a beating.
Position: Sell
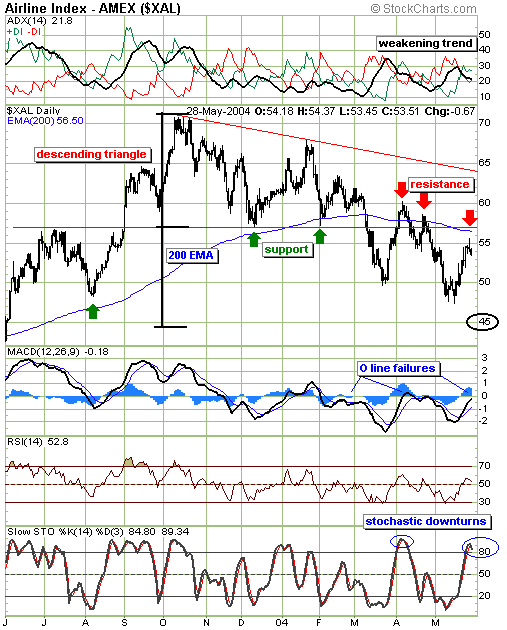
| The principle of previous resistance-turned-support can be seen in the formation of the large descending triangle on the XAL's chart. Last March the XAL broke out of this bearish pattern when it slipped below $57. Since then, two unsuccessful attempts were made to stay above the triangle's lower trendline. Now it appears that the current attempt has failed just short of that trendline, establishing a weakening trend. |
| The downside target for this pattern failure is the $45 area, this being equal to the distance of the maximum height within the triangle, as applied to the downside measure below the base of the triangle. |

|
| Daily chart shows the declining trend in this airline index. |
| Graphic provided by: Stockcharts.com. |
| |
| The 200-day EMA (exponential moving average) also figures prominently in this picture. This major moving average is watched by many a chartist and fund manager as a major bear/bull indicator. Bullish potential or trend is generally above this mark and likewise a move below this threshold is often a sign of a major shift in trend. The green arrows show how support held very near the 200-day EMA until it finally broke through in March. Now the moving average is acting as upside resistance as shown by the red arrows. This last failure just shy of the 200-day EMA could characterize the XAL as being in a "failure mode." As long as this index remains below this mark, a bearish trend remains in place. This past failure could have attracted short sellers-- those that read the pattern as a triangle failure or a significant moving average failure. |
| Several indicators are also worth considering. The ADX component (top graph) shows weakening trend strength. Although there has been a bullish DI reversal, the weakening ADX shows the DI reversal as being suspect or potentially short-lived. The MACD or moving average convergence/divergence shows a pattern of failure at or near the often crucial zero line. However the most ominous indicator displayed is the stochastic indicator. Stochastic downturns from above the 80 level often lead to a significant downleg. During periods considered "non-trending" --such as when there are low ADX values-- stochastic downturns and upturns become a better indicator of market moves with less whipsaws or false moves. The last stochastic downleg coincided with a sizable decline and this one can be similar. |
| Either way you view the recent XAL downturn, because it is below the descending triangle and the 200-day EMA, brings the spectre of a significant change in trend. A move back above the 200-day EMA could mean a test of the upper triangle trendline but this seems rather unlikely for now. |
Independent Canadian equities trader and technical analyst based in Peterborough
Ontario, Canada.
| Website: | www.whatsonsale.ca/financial.html |
| E-mail address: | gwg7@sympatico.ca |
Click here for more information about our publications!
Comments

Request Information From Our Sponsors
- StockCharts.com, Inc.
- Candle Patterns
- Candlestick Charting Explained
- Intermarket Technical Analysis
- John Murphy on Chart Analysis
- John Murphy's Chart Pattern Recognition
- John Murphy's Market Message
- MurphyExplainsMarketAnalysis-Intermarket Analysis
- MurphyExplainsMarketAnalysis-Visual Analysis
- StockCharts.com
- Technical Analysis of the Financial Markets
- The Visual Investor
- VectorVest, Inc.
- Executive Premier Workshop
- One-Day Options Course
- OptionsPro
- Retirement Income Workshop
- Sure-Fire Trading Systems (VectorVest, Inc.)
- Trading as a Business Workshop
- VectorVest 7 EOD
- VectorVest 7 RealTime/IntraDay
- VectorVest AutoTester
- VectorVest Educational Services
- VectorVest OnLine
- VectorVest Options Analyzer
- VectorVest ProGraphics v6.0
- VectorVest ProTrader 7
- VectorVest RealTime Derby Tool
- VectorVest Simulator
- VectorVest Variator
- VectorVest Watchdog
