HOT TOPICS LIST
- MACD
- Fibonacci
- RSI
- Gann
- ADXR
- Stochastics
- Volume
- Triangles
- Futures
- Cycles
- Volatility
- ZIGZAG
- MESA
- Retracement
- Aroon
INDICATORS LIST
LIST OF TOPICS
PRINT THIS ARTICLE
by Steven Coffey
Now that Met-Pro Corp. (MPR) has closed below its most recent low of $15, it is officially in a downtrend.
Position: Sell
Steven Coffey
Steven Coffey is an independent stock trader with a background in Information Systems development and training. He resides in the Boston area.
PRINT THIS ARTICLE
Met-Pro Corp. Now In A Downtrend
05/28/04 12:31:58 PMby Steven Coffey
Now that Met-Pro Corp. (MPR) has closed below its most recent low of $15, it is officially in a downtrend.
Position: Sell
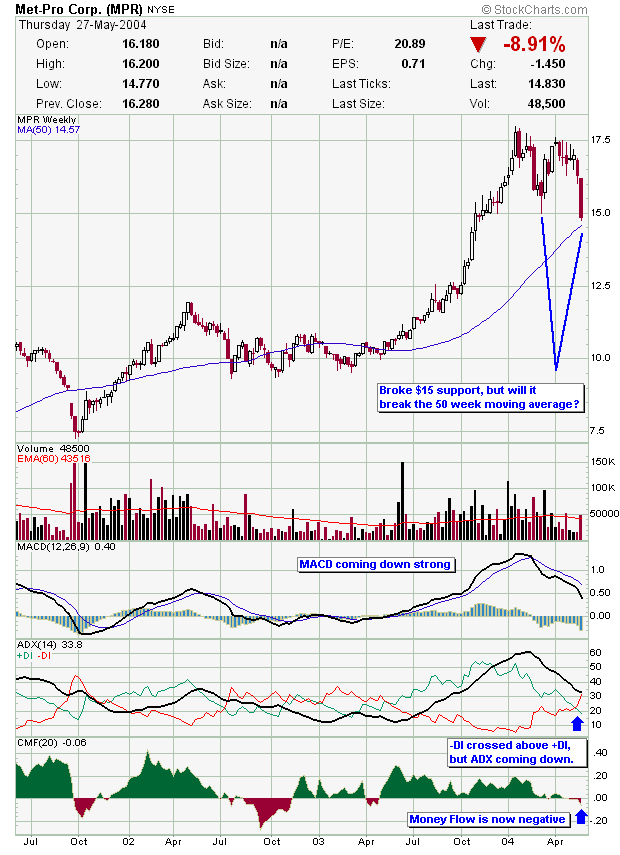
| According to classic Dow theory, a stock is considered to have gone into a downtrend after it has made a lower high and then a lower low. This is precisely what Met-Pro Corp. did when it closed Thursday at $14.83, and breached its March low of exactly $15. |
| Looking at the chart, you can see that between October 2001 and January 2004, MPR had a solid run up from a low of less than $7.50 to about $18. Since then, it came down to $15 in March, and could only go as high as $17.50 about a month later. The fact that it couldn't reach its previous high of $18 was a tipoff that this stock might be in danger. Thursday's close below the most recent low of $15 confirms this. |

|
| Weekly chart of MPR. |
| Graphic provided by: Stockcharts.com. |
| |
| What's more, the MACD is coming down strong and doesn't show any signs of a reversal. Even the MACD histogram is coming down sharply. The histogram depicts the distance between the two MACD lines. Generally, when a stock is about to reverse upward, the MACD histogram will start coming up, indicating that the MACD will soon cross above its signal line, which would confirm a reversal of the downtrend. But this isn't happening in the slightest. In fact, if you look at the Chaikin money flow indicator at the bottom of the chart, you can see that for the first time in a year, this indicator has gone negative. This would seem to indicate that selling pressure has overcome the buying pressure that pushed this stock up over the past year, and the current owners are looking to get out of their positions. |
| The ADX is confirming this selling pressure. Recently the -DI (red line) crossed above the +DI (green line). This shows that the force of the down moves of this stock are now greater than the force of the up moves. However, I find it necessary to make an observation about the ADX itself (black line). For pretty much the entire time that Met-Pro Corp. went up, particularly between June 2003 and January 2004, the ADX also went up. This indicates increasing strength in that uptrend. Since January/February, the ADX has been coming down, along with the price. This indicates that this current downtrend isn't as strong as the uptrend that preceded it. When the price and ADX go up together and then come down together, this often means that the present downtrend is only a retracement in an overall long-term uptrend. So although I expect MPR to come down, I don't think that's the primary trend. It may even start bouncing off the 50-week moving average and go up from there. But more realistically, I would set a target of about $12, which was its high in May 2002. |
Steven Coffey is an independent stock trader with a background in Information Systems development and training. He resides in the Boston area.
| E-mail address: | stevencoffey@yahoo.com |
Click here for more information about our publications!
Comments
Date: 05/30/04Rank: 2Comment:

Request Information From Our Sponsors
- VectorVest, Inc.
- Executive Premier Workshop
- One-Day Options Course
- OptionsPro
- Retirement Income Workshop
- Sure-Fire Trading Systems (VectorVest, Inc.)
- Trading as a Business Workshop
- VectorVest 7 EOD
- VectorVest 7 RealTime/IntraDay
- VectorVest AutoTester
- VectorVest Educational Services
- VectorVest OnLine
- VectorVest Options Analyzer
- VectorVest ProGraphics v6.0
- VectorVest ProTrader 7
- VectorVest RealTime Derby Tool
- VectorVest Simulator
- VectorVest Variator
- VectorVest Watchdog
- StockCharts.com, Inc.
- Candle Patterns
- Candlestick Charting Explained
- Intermarket Technical Analysis
- John Murphy on Chart Analysis
- John Murphy's Chart Pattern Recognition
- John Murphy's Market Message
- MurphyExplainsMarketAnalysis-Intermarket Analysis
- MurphyExplainsMarketAnalysis-Visual Analysis
- StockCharts.com
- Technical Analysis of the Financial Markets
- The Visual Investor
