

HOT TOPICS LIST
- MACD
- Fibonacci
- RSI
- Gann
- ADXR
- Stochastics
- Volume
- Triangles
- Futures
- Cycles
- Volatility
- ZIGZAG
- MESA
- Retracement
- Aroon
INDICATORS LIST
LIST OF TOPICS
PRINT THIS ARTICLE
by Koos van der Merwe
A variety of technical indicators that I use are giving buy signals for this stock, but common sense may tell you otherwise.
Position: Accumulate
Koos van der Merwe
Has been a technical analyst since 1969, and has worked as a futures and options trader with First Financial Futures in Johannesburg, South Africa.
PRINT THIS ARTICLE
STUDY COURSES
Transition Therapeutics Inc.
05/27/04 12:03:24 PMby Koos van der Merwe
A variety of technical indicators that I use are giving buy signals for this stock, but common sense may tell you otherwise.
Position: Accumulate
| TRANSITION THERAPEUTICS INC. is a biopharmaceutical company engaged in the business of developing approaches and therapeutics for patients with diabetes, multiple sclerosis and restenosis. I am usually nervous about biopharmaceutical companies, as they are looking for cures (and eating cash in the process) using laboratory animals. They may work in rats and mice, but in the complexity that is the human body, they may not. Here is one company that can be watched and bought if you are prepared to take the gamble that they have a cure. |
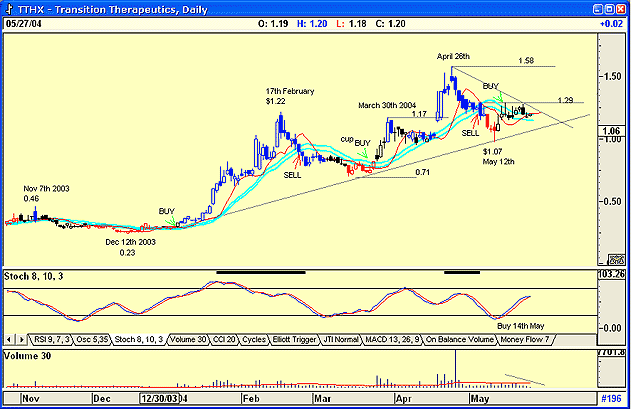
| Looking at the chart below, the share price for Transition Therapeutics traded in the range of $0.23 to $0.47 until December 12, 2003, when it started to move up on above average volume. A high was reached on February 2nd, 2004 at $1.22, and the price moved down to form the familiar cup with handle formation, the handle being at $1.17. On April 20th, the price broke above this level on a gap with strong volume. This gave a target of $1.63 (1.17 - 0.71 = 0.46 + 1.17 = 1.63) . On April 26th, the price hit $1.58, on a weakening stochastic oscillator and strong volume. The price fell away on weak volume, a sign of strength, to $1.07 by May 12th. At the moment it is testing $1.29, a resistance level, on low volume -- a sign of strength. |
|
| Transition Therapeutics. |
| Graphic provided by: AdvancedGET. |
| |
| The chart also shows the XTL (eXpert Trend Locator) Parameter . This indicator uses a statistical evaluation of the market that can tell the difference between random market swings (noise) and directed market swings (trends). You can search for an XTL that is in an uptrend, downtrend, or either up- or downtrend. The indicator colors the candlesticks as follows: Up - blue, down - red, or neutral - black. The period I have used to calculate the XTL is 35. At the moment XTL is neutral, so I would not be a buyer using this strategy. |
| The second indicator I have used is the JM internal trend band. This indicator is one of my favorites, and has been very kind to me over the years. The JM internal band is a 15-period simple moving average offset by 2% up and -2% down. A break above the upper band is a buy signal, and a break below the lower band is a sell signal. I have shown the buy and sell signals on the chart with green and red arrows. At the moment, the JM indicator has given a buy signal. This ties in with the stochastic which suggested a buy on May 14th. |
| Finally, for the more cautious, a consolidation triangle appears to be forming. A breakout above $1.25 - $1.29 suggests a target of $2.16. (1.58 - 0.71 = 0.87 + 1.29 = 2.16). Weighing out the pluses and minuses, I would be a buyer of this share at present levels. |
Has been a technical analyst since 1969, and has worked as a futures and options trader with First Financial Futures in Johannesburg, South Africa.
| Address: | 3256 West 24th Ave |
| Vancouver, BC | |
| Phone # for sales: | 6042634214 |
| E-mail address: | petroosp@gmail.com |
Click here for more information about our publications!
PRINT THIS ARTICLE

Request Information From Our Sponsors
- StockCharts.com, Inc.
- Candle Patterns
- Candlestick Charting Explained
- Intermarket Technical Analysis
- John Murphy on Chart Analysis
- John Murphy's Chart Pattern Recognition
- John Murphy's Market Message
- MurphyExplainsMarketAnalysis-Intermarket Analysis
- MurphyExplainsMarketAnalysis-Visual Analysis
- StockCharts.com
- Technical Analysis of the Financial Markets
- The Visual Investor
- VectorVest, Inc.
- Executive Premier Workshop
- One-Day Options Course
- OptionsPro
- Retirement Income Workshop
- Sure-Fire Trading Systems (VectorVest, Inc.)
- Trading as a Business Workshop
- VectorVest 7 EOD
- VectorVest 7 RealTime/IntraDay
- VectorVest AutoTester
- VectorVest Educational Services
- VectorVest OnLine
- VectorVest Options Analyzer
- VectorVest ProGraphics v6.0
- VectorVest ProTrader 7
- VectorVest RealTime Derby Tool
- VectorVest Simulator
- VectorVest Variator
- VectorVest Watchdog