HOT TOPICS LIST
- MACD
- Fibonacci
- RSI
- Gann
- ADXR
- Stochastics
- Volume
- Triangles
- Futures
- Cycles
- Volatility
- ZIGZAG
- MESA
- Retracement
- Aroon
INDICATORS LIST
LIST OF TOPICS
PRINT THIS ARTICLE
by Sean Moore
Horizontal formations in point & figure charts can help to signify when a security is likely to make a move. The longer the stock moves in a sideways fashion, the greater the potential for a move. This concept was an important building block for Richard D. Wyckoff's stock analysis method.
Position: N/A
Sean Moore
Traders.com Staff Writer.
PRINT THIS ARTICLE
STRATEGIES
Wyckoff Part 3: Recognizing Potential
05/11/00 04:26:16 PMby Sean Moore
Horizontal formations in point & figure charts can help to signify when a security is likely to make a move. The longer the stock moves in a sideways fashion, the greater the potential for a move. This concept was an important building block for Richard D. Wyckoff's stock analysis method.
Position: N/A
| In the third step in Wyckoff's stock analysis procedure, the trader uses point & figure charts to further pinpoint those securities with the greatest opportunity to yield a profit. Parts 1 and 2 of the Wyckoff method began identifying those potentially profitable securities by establishing the market trend, then analyzing the relative strengths of various overperforming sectors and securities. |
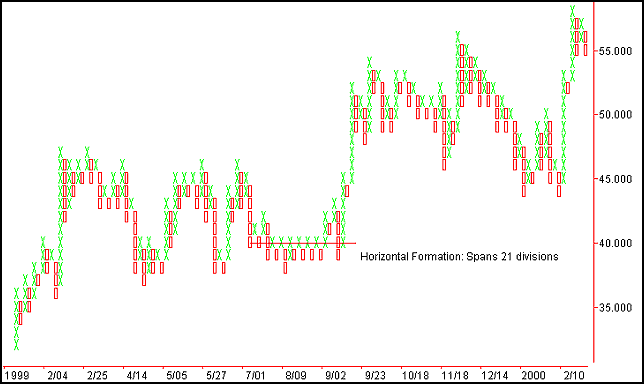
| A point & figure chart can be quickly analyzed. A horizontal formation after a decline indicates that operators are willing to support the stock and stem the decline. After a rally, a horizontal formation uncovers the supply that's being offered and signals a downturn in prices as soon as the supply meets the demand. One general rule of point & figure charting states that the number of times a figure is repeated in a horizontal formation is the number of points a stock will advance from its low or decline from its peak. Figure 1 shows a horizonal formation on the point & figure chart for Citigroup Corp. This formation follows a slight downtrend and spans 21 divisions, signifying a potential for a 20+ point rise. This rise was realized in the few months that followed the horizontal formation. |

|
| Figure 1: Point & figure chart for Citigroup Inc. shows the buildup of a horizontal formation and the associated uptrend that followed. |
| Graphic provided by: TradeStation. |
| |
| Wyckoff states that those stocks with the largest horizontal ranges represent the best candidates in which to establish positions. Using this in combination with Step 2 of the Wyckoff method (determining which securities are outperforming the market) help the trader ease closer to making a trading decision. |
| Related Articles: Wyckoff Part 1: Defining A Trend Wyckoff Part 2: Determining Relative Strength And Weakness |
Traders.com Staff Writer.
| Title: | Project Engineer |
| Company: | Technical Analysis, Inc. |
| Address: | 4757 California Ave. SW |
| Seattle, WA 98116 | |
| Phone # for sales: | 206 938 0570 |
| Fax: | 206 938 1307 |
| Website: | Traders.com |
| E-mail address: | smoore@traders.com |
Traders' Resource Links | |
| Charting the Stock Market: The Wyckoff Method -- Books | |
| Working-Money.com -- Online Trading Services | |
| Traders.com Advantage -- Online Trading Services | |
| Technical Analysis of Stocks & Commodities -- Publications and Newsletters | |
| Working Money, at Working-Money.com -- Publications and Newsletters | |
| Traders.com Advantage -- Publications and Newsletters | |
| Professional Traders Starter Kit -- Software | |
Click here for more information about our publications!
Comments
Date: / /Rank: 3Comment: nice chart. just a test

Request Information From Our Sponsors
- StockCharts.com, Inc.
- Candle Patterns
- Candlestick Charting Explained
- Intermarket Technical Analysis
- John Murphy on Chart Analysis
- John Murphy's Chart Pattern Recognition
- John Murphy's Market Message
- MurphyExplainsMarketAnalysis-Intermarket Analysis
- MurphyExplainsMarketAnalysis-Visual Analysis
- StockCharts.com
- Technical Analysis of the Financial Markets
- The Visual Investor
- VectorVest, Inc.
- Executive Premier Workshop
- One-Day Options Course
- OptionsPro
- Retirement Income Workshop
- Sure-Fire Trading Systems (VectorVest, Inc.)
- Trading as a Business Workshop
- VectorVest 7 EOD
- VectorVest 7 RealTime/IntraDay
- VectorVest AutoTester
- VectorVest Educational Services
- VectorVest OnLine
- VectorVest Options Analyzer
- VectorVest ProGraphics v6.0
- VectorVest ProTrader 7
- VectorVest RealTime Derby Tool
- VectorVest Simulator
- VectorVest Variator
- VectorVest Watchdog
