HOT TOPICS LIST
- MACD
- Fibonacci
- RSI
- Gann
- ADXR
- Stochastics
- Volume
- Triangles
- Futures
- Cycles
- Volatility
- ZIGZAG
- MESA
- Retracement
- Aroon
INDICATORS LIST
LIST OF TOPICS
PRINT THIS ARTICLE
by Gary Grosschadl
Although it sounds outlandish, $50 oil looks like a possibility on this chart.
Position: Hold
Gary Grosschadl
Independent Canadian equities trader and technical analyst based in Peterborough
Ontario, Canada.
PRINT THIS ARTICLE
CHART ANALYSIS
$50 Oil?
05/27/04 08:16:09 AMby Gary Grosschadl
Although it sounds outlandish, $50 oil looks like a possibility on this chart.
Position: Hold
| Today crude oil for July delivery rose $1.79 to close at $41.72, beating last week's closing high of $41.55 - the highest in 21 years. This has the attention of everyone including the unfortunate fellows at the gas pumps. |
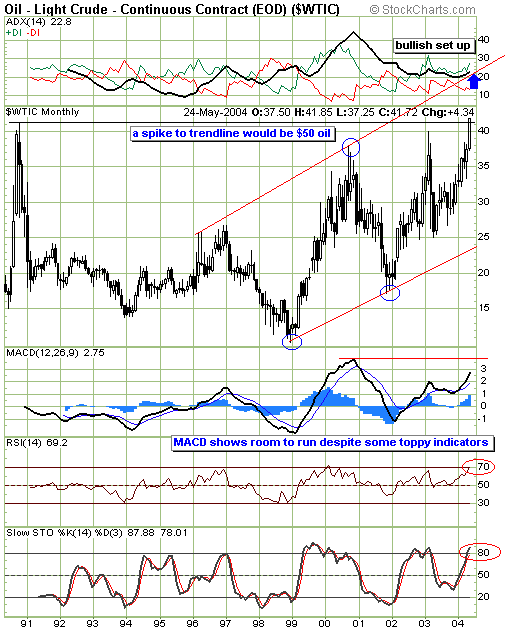
| To get a longer term perspective on this, I consulted a longer term monthly chart. What is suggested here is a powerful upleg in a rising channel pattern. By extrapolation, a surge or spike to the upper trendline would result in $50 oil. Should this occur, the main indexes could be battered as economic woes would grow, even if it turns out to be a brief spike. Gold, on the other hand, could surge up as inflation concerns are factored in. |

|
| Monthy oil chart going back 14 years. |
| Graphic provided by: Stockcharts.com. |
| |
| Several indicators are worth a look as traders try to gauge what may transpire. The topmost graph shows a strengthening trend, not an overheated one, implying more upside potential. The ideal DMI (directional movement index) has the ADX rising in a good upslope, between both DIs as shown. Some traders prefer to see an ADX value above 25 to confirm a strong trend but a good upslope above 20 always gets my attention. The MACD (moving average convergence/divergence) hints at more upside room when looking at its previous peak. The two lower indicators reflect a toppy zone being reached, however a strong and rising trend could sustain a toppy level for an extended time as was the case back in 2000 when oil spiked up to the upper trendline. |
| Note the dramatic swings in oil prices. Oil has more than tripled from 1999 to 2001, going from $11 to $38. The subsequent year the price dropped 50%. The following year it doubled again from $20 to $40. In 2003 the price of oil dropped back down to a more reasonable level of $25. Should this current long-term upswing (off $25) cause the crude price to double again, then $50 oil is a possibility. |
Independent Canadian equities trader and technical analyst based in Peterborough
Ontario, Canada.
| Website: | www.whatsonsale.ca/financial.html |
| E-mail address: | gwg7@sympatico.ca |
Click here for more information about our publications!
Comments
Date: 05/28/04Rank: 5Comment:
Date: 06/01/04Rank: 2Comment:
Date: 06/02/04Rank: 5Comment:
Date: 06/12/04Rank: 1Comment: wrong

Request Information From Our Sponsors
- StockCharts.com, Inc.
- Candle Patterns
- Candlestick Charting Explained
- Intermarket Technical Analysis
- John Murphy on Chart Analysis
- John Murphy's Chart Pattern Recognition
- John Murphy's Market Message
- MurphyExplainsMarketAnalysis-Intermarket Analysis
- MurphyExplainsMarketAnalysis-Visual Analysis
- StockCharts.com
- Technical Analysis of the Financial Markets
- The Visual Investor
- VectorVest, Inc.
- Executive Premier Workshop
- One-Day Options Course
- OptionsPro
- Retirement Income Workshop
- Sure-Fire Trading Systems (VectorVest, Inc.)
- Trading as a Business Workshop
- VectorVest 7 EOD
- VectorVest 7 RealTime/IntraDay
- VectorVest AutoTester
- VectorVest Educational Services
- VectorVest OnLine
- VectorVest Options Analyzer
- VectorVest ProGraphics v6.0
- VectorVest ProTrader 7
- VectorVest RealTime Derby Tool
- VectorVest Simulator
- VectorVest Variator
- VectorVest Watchdog
