

HOT TOPICS LIST
- MACD
- Fibonacci
- RSI
- Gann
- ADXR
- Stochastics
- Volume
- Triangles
- Futures
- Cycles
- Volatility
- ZIGZAG
- MESA
- Retracement
- Aroon
INDICATORS LIST
LIST OF TOPICS
PRINT THIS ARTICLE
by Steven Coffey
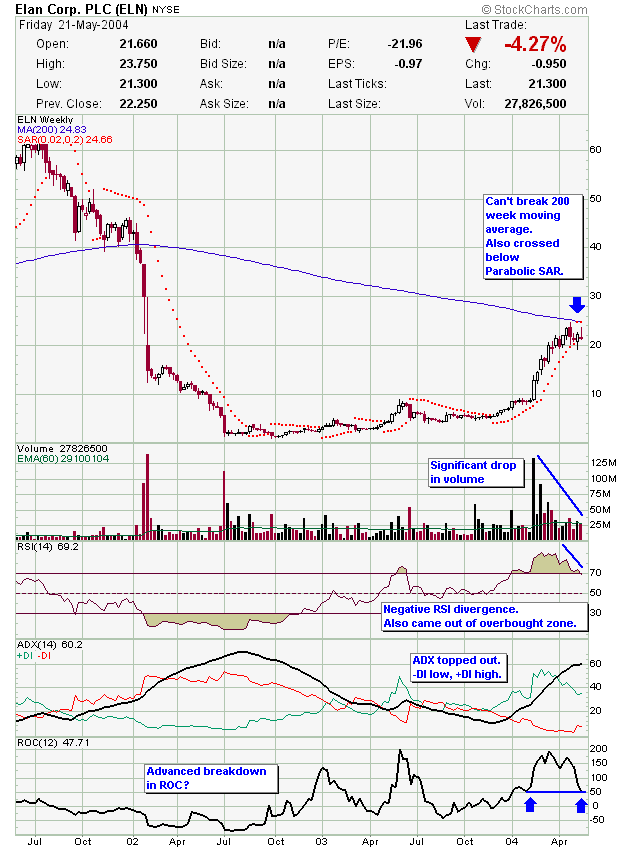
After a nice ride up, ELN seems to be running into resistance at the 200-week moving average. It will have to cross above this level in order to be bullish again, but does it have the strength?
Position: Sell
Steven Coffey
Steven Coffey is an independent stock trader with a background in Information Systems development and training. He resides in the Boston area.
PRINT THIS ARTICLE
CHART ANALYSIS
Elan Corp. Can't Break 200-Week Moving Average
05/25/04 09:22:41 AMby Steven Coffey
After a nice ride up, ELN seems to be running into resistance at the 200-week moving average. It will have to cross above this level in order to be bullish again, but does it have the strength?
Position: Sell
| The 200-period moving average is generally a significant indicator of support and resistance. After a breakout above $10 in February, Elan Corp. more than doubled, and now seems to be having difficulty crossing above its 200-week moving average. |
|
| Graphic provided by: Stockchart.com. |
| |
| Looking at the chart, you can also see that not only is ELN running into this key resistance area, but two weeks ago it crossed below the Parabolic SAR. Although this indicator is a little difficult to spot on this chart because the two Parabolic SAR dots coincide with the moving average line, if you look closely, you can see it. SAR stands for "stop and reversal." This indicator is used by traders to determine entry and exit points. When a stock crosses above the SAR, the dot moves below the price, and that's a signal to buy, and vice versa. This signal is especially useful in trending markets, such as the one ELN is in now. Since this stock has been below the Parabolic SAR for two weeks, this is a strong signal to get out. |
| The volume also doesn't bode well for the intermediate future of ELN. The highest volume in this current uptrend took place when the stock broke out above $10. That was a very bullish signal. However, since then, the volume has been dropping considerably, even as the price has gone up. This shows that the buying pressure that propelled this stock upward has dissipated. I don't see how this stock can break above the 200-week moving average with these anemic volume levels. |
| Directing your attention to the lower half of the chart, please note the RSI. This indicator has been coming down since March, although the price was still going up at the time. This is called a negative divergence, and it generally portends a drop in price. What's more, the RSI has just come below its overbought level of 70. This indicator now seems to be on its way down. Another momentum oscillator is the rate of change. The ROC on this chart is practically showing what's known as an advanced breakdown. This happens when momentum reaches a new low before the price does. You can see that the ROC is at the same level it was in late January/early February. However, the price is currently at almost $22, compared with less than $10 the last time the ROC was this low. Given the much higher price that ELN is at right now, I would expect the ROC to also be higher, but it's actually almost lower. These two momentum oscillators, RSI and ROC, are showing an alarming loss of upward momentum, and since momentum leads price, we should expect the price of this stock to follow this downward trend. One final indicator is the ADX. In this current uptrend, the ADX seems to be topping out above 60. This is considered to be an extreme level for this indicator. It shows that the strength of the uptrend has topped out and there's no more energy left to push it higher. Also in this indicator panel, the -DI (red line - shows the strength of the downmoves) has bottomed out and now appears to be on the upswing. This shows that the force of the downmoves has become weak (which is to be expected in an uptrend), but may begin picking up steam soon. Meanwhile, the +DI, represented by the green line, is showing that the strength of the upmoves is actually dissipating, much like the RSI and ROC. Put the two together, and it's plain to see that the downward strength will soon overcome the upward strength, which should drive the stock price down. Given all these signals, I think that ELN, at least for the intermediate term, is done with its uptrend. Perhaps in the long-term, this stock may rebound, but for now, it's on its way down. |
Steven Coffey is an independent stock trader with a background in Information Systems development and training. He resides in the Boston area.
| E-mail address: | stevencoffey@yahoo.com |
Click here for more information about our publications!
Comments
Date:�05/25/04Rank:�1Comment:�this is a bullish flag with lower volume.
you shouldn t use indicators without considering chart patterns. bye.
and in trending markets divergences are worthless.

Request Information From Our Sponsors
- StockCharts.com, Inc.
- Candle Patterns
- Candlestick Charting Explained
- Intermarket Technical Analysis
- John Murphy on Chart Analysis
- John Murphy's Chart Pattern Recognition
- John Murphy's Market Message
- MurphyExplainsMarketAnalysis-Intermarket Analysis
- MurphyExplainsMarketAnalysis-Visual Analysis
- StockCharts.com
- Technical Analysis of the Financial Markets
- The Visual Investor
- VectorVest, Inc.
- Executive Premier Workshop
- One-Day Options Course
- OptionsPro
- Retirement Income Workshop
- Sure-Fire Trading Systems (VectorVest, Inc.)
- Trading as a Business Workshop
- VectorVest 7 EOD
- VectorVest 7 RealTime/IntraDay
- VectorVest AutoTester
- VectorVest Educational Services
- VectorVest OnLine
- VectorVest Options Analyzer
- VectorVest ProGraphics v6.0
- VectorVest ProTrader 7
- VectorVest RealTime Derby Tool
- VectorVest Simulator
- VectorVest Variator
- VectorVest Watchdog