HOT TOPICS LIST
- MACD
- Fibonacci
- RSI
- Gann
- ADXR
- Stochastics
- Volume
- Triangles
- Futures
- Cycles
- Volatility
- ZIGZAG
- MESA
- Retracement
- Aroon
INDICATORS LIST
LIST OF TOPICS
PRINT THIS ARTICLE
by Jason K. Hutson
A downward trend followed by progressively higher lows had produced a triangle formation for SYMC. Then stock prices broke out below the lower support line.
Position: N/A
Jason K. Hutson
Traders.com Staff Writer. Enjoys trendlines, support and resistance, moving averages, RSI, MACD, ADX, Bollinger bands, parabolic SAR, chart formations, and volume analysis.
PRINT THIS ARTICLE
TRIANGLES
Triangle Formations
05/15/00 09:47:37 AMby Jason K. Hutson
A downward trend followed by progressively higher lows had produced a triangle formation for SYMC. Then stock prices broke out below the lower support line.
Position: N/A
| Triangles are a classic type of chart formation that can signal either a reversal or a continuation of a trend. The triangle is formed by the convergence of two trendlines- an upper resistance and lower support line. The ascending triangle is particularly significant because it forms less frequently than the other descending or symmetrical triangle patterns, and is more likely to be signaling an upward movement in the security. When an ascending triangle formation occurs, it usually signals a continuation pattern in an uptrend, but sometimes can be found at the bottom of a downtrend, signaling a reversal. The ascending triangle has a flat upper trendline while the lower trendline slopes upward. This is indicative of more aggressive buying than selling as the lows get progressively higher, while the highs make it to about the same level each time before breaking out to the upside. |
| The completion of the formation occurs when prices break through the upper, flat trendline, before finishing the apex of the triangle. Prices could retrace to the horizontal trendline before resuming their upward path but not reenter the triangle. Unlike symmetrical triangles, which are neutral in predicting breakout direction, ascending triangles usually break to the upside. This is also true when preceded by an uptrend, and when this happens, ascending triangles act as a continuation pattern, rather than a bottom. |

|
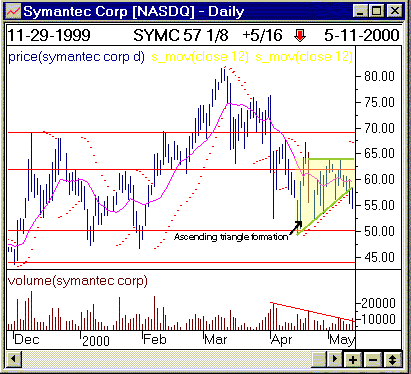
| THE ASCENDING TRIANGLE BOTTOM. This is identified by the formation of a flat upper trendline and ascending lower trendline. |
| Graphic provided by: Window. |
| |
| Typically, volume is heavy at the beginning and contracts during the formation of an ascending triangle. It again increases during the breakout above the flat trendline. This corresponds to the number of shares for sale diminishing at the upper trendline price, as buyers bid the stock up and try to catch the breakout. In this situation a tight stop could have been placed right along that upward trendline (bottom of the triangle). This would have minimized the risk for a LONG trade. Now a trader can view the previous support line as a possible resistance level. |
| In the above graph, a very promising upward triangle began forming for Symantec Corp. (SYMC). But the prices broke through the bottom support line signaling a continuation of the downtrend, rather than the expected upswing in prices. The graph from a previous article,How to Profit From Trading Ranges, Example 2, shows a possible support level following the breakout of SYMC's triangle formation. |
Traders.com Staff Writer. Enjoys trendlines, support and resistance, moving averages, RSI, MACD, ADX, Bollinger bands, parabolic SAR, chart formations, and volume analysis.
| Title: | Industrial Engineer |
| Company: | Technical Analysis, Inc. |
| Address: | 4757 California Ave SW |
| Seattle, WA 98116 | |
| Phone # for sales: | 206 938 0570 |
| Website: | Traders.com |
| E-mail address: | JasonHutson@Traders.com |
Traders' Resource Links | |
| Charting the Stock Market: The Wyckoff Method -- Books | |
| Working-Money.com -- Online Trading Services | |
| Traders.com Advantage -- Online Trading Services | |
| Technical Analysis of Stocks & Commodities -- Publications and Newsletters | |
| Working Money, at Working-Money.com -- Publications and Newsletters | |
| Traders.com Advantage -- Publications and Newsletters | |
| Professional Traders Starter Kit -- Software | |
Click here for more information about our publications!
Comments

|

Request Information From Our Sponsors
- StockCharts.com, Inc.
- Candle Patterns
- Candlestick Charting Explained
- Intermarket Technical Analysis
- John Murphy on Chart Analysis
- John Murphy's Chart Pattern Recognition
- John Murphy's Market Message
- MurphyExplainsMarketAnalysis-Intermarket Analysis
- MurphyExplainsMarketAnalysis-Visual Analysis
- StockCharts.com
- Technical Analysis of the Financial Markets
- The Visual Investor
- VectorVest, Inc.
- Executive Premier Workshop
- One-Day Options Course
- OptionsPro
- Retirement Income Workshop
- Sure-Fire Trading Systems (VectorVest, Inc.)
- Trading as a Business Workshop
- VectorVest 7 EOD
- VectorVest 7 RealTime/IntraDay
- VectorVest AutoTester
- VectorVest Educational Services
- VectorVest OnLine
- VectorVest Options Analyzer
- VectorVest ProGraphics v6.0
- VectorVest ProTrader 7
- VectorVest RealTime Derby Tool
- VectorVest Simulator
- VectorVest Variator
- VectorVest Watchdog
