HOT TOPICS LIST
- MACD
- Fibonacci
- RSI
- Gann
- ADXR
- Stochastics
- Volume
- Triangles
- Futures
- Cycles
- Volatility
- ZIGZAG
- MESA
- Retracement
- Aroon
INDICATORS LIST
LIST OF TOPICS
PRINT THIS ARTICLE
by Steven Coffey
After completing a 6-month retracement in a long-term uptrend, Pharmaceutical Resources (PRX) now appears ready to resume its upward movement.
Position: Buy
Steven Coffey
Steven Coffey is an independent stock trader with a background in Information Systems development and training. He resides in the Boston area.
PRINT THIS ARTICLE
TECHNICAL INDICATORS
Pharmaceutical Resources Bottoming Out
05/20/04 10:58:13 AMby Steven Coffey
After completing a 6-month retracement in a long-term uptrend, Pharmaceutical Resources (PRX) now appears ready to resume its upward movement.
Position: Buy
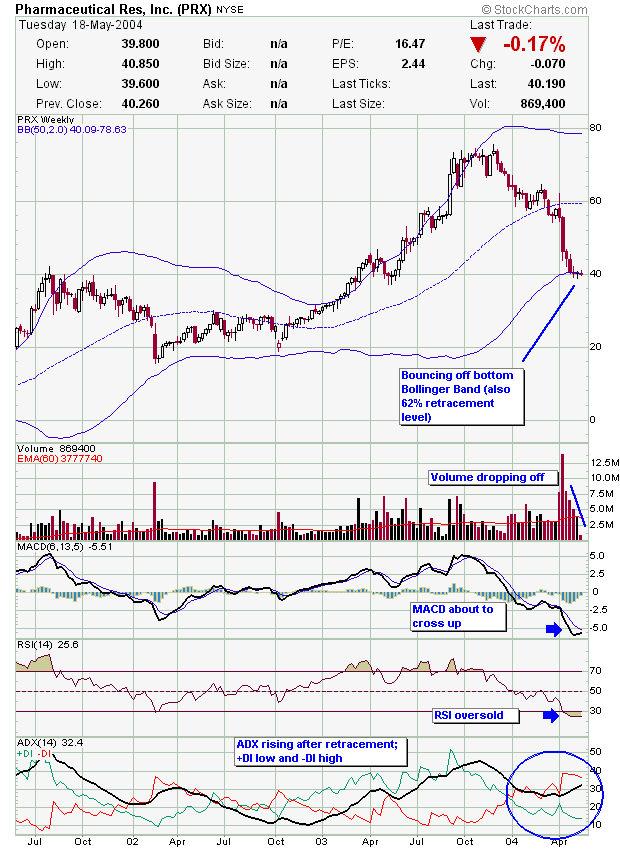
| It appears that PRX is just completing a retracement in an overall long term uptrend. Back in late November and early December, this stock topped out at about $75. Since then, it has come down to $40. Based on technical indicators, PRX appears ready to begin its second leg up. |
| The first thing I noticed about this stock is that it is bottoming out quite nicely at its 62% Fibonacci retracement level, using the February 2002 lows and November 2003 highs. To avoid cluttering the chart, I chose not to display these retracement levels. However, I did display the 50-week Bollinger Bands. You can see that the price is bouncing off the bottom band, which coincides with the 62% retracement level. Both of these indicators seem to be serving as strong support, and I would expect the price to bounce up from here. Also note the support established with the high set in August 2001 and the temporary low set in May 2003, both around the $40 mark. I wouldn't expect the price to break through this area of support, as the volume has dropped off considerably. When volume picks up again, it should drive the price upward, not further down. |

|
| Weekly chart of Pharmaceutical Resources. |
| Graphic provided by: Stockchart.com. |
| |
| Looking at the indicators in the lower half of the chart, you can see that the MACD is coming up and appears to be about to cross above the signal line. If this happens, it should cause the RSI to come up and out of its oversold zone. These events are considered bullish and generally portend a rise in price. Finally, I really like the patterns the ADX is making. When this stock began declining late last year, so did the ADX. Because the ADX measures the strength of the trend, when we see a declining ADX with a declining price, it generally means that the decline in price is just a retracement from the overall trend, which in this case is up. In early April, the ADX started coming back up again, so this tells me that the uptrend is beginning to resume. What makes this even sweeter is that the +DI (the strength of the upmoves) has bottomed out, while the -DI (the strength of the downmoves) is high. I think what will happen soon is that these will start to reverse, with the up moves becoming stronger, and the down moves diminishing. Again, this is a bullish pattern. |
| In the big picture, Pharmaceutical Resources has been in an overall uptrend for the past two years. The last six months have seen a retracement, and this stock now appears to have bottomed out and is ready to rumble again. It's at a significant support level, and the major indicators appear to be saying it's oversold. In the short to intermediate term it could go into the high $50s, where it should run into some resistance from the high set in July 2003 and the low set in February of this year. This should also coincide with the 50-week moving average. On the other hand, if the volume starts picking up and it drives the price below $40, and the bottom Bollinger Band starts coming down, then all bullish bets are off, and it's time to cut your losses and get out. |
Steven Coffey is an independent stock trader with a background in Information Systems development and training. He resides in the Boston area.
| E-mail address: | stevencoffey@yahoo.com |
Click here for more information about our publications!
Comments
Date: 05/21/04Rank: 4Comment: Steven,
I found your article and analysis very interesting and I am wondering if you will not wait for a catalyst before buying. As you mentioned, we had a similar situation in March and October last year. But I guess the rebound begins because of:
3/4/2003: Pharmaceutical Resources to Present at Salomon Smith Barney and 3/5/2003: Pharmaceutical Resources Buys 5 Bristol-Myers Drugs. Finally, 10/21/2003: Pharmaceutical Announces Filing Of Tramadol Hydrochloride
If you agree, which kind of catalyst would you except nowadays.
Thank you for your insight,
Pascal

Request Information From Our Sponsors
- StockCharts.com, Inc.
- Candle Patterns
- Candlestick Charting Explained
- Intermarket Technical Analysis
- John Murphy on Chart Analysis
- John Murphy's Chart Pattern Recognition
- John Murphy's Market Message
- MurphyExplainsMarketAnalysis-Intermarket Analysis
- MurphyExplainsMarketAnalysis-Visual Analysis
- StockCharts.com
- Technical Analysis of the Financial Markets
- The Visual Investor
- VectorVest, Inc.
- Executive Premier Workshop
- One-Day Options Course
- OptionsPro
- Retirement Income Workshop
- Sure-Fire Trading Systems (VectorVest, Inc.)
- Trading as a Business Workshop
- VectorVest 7 EOD
- VectorVest 7 RealTime/IntraDay
- VectorVest AutoTester
- VectorVest Educational Services
- VectorVest OnLine
- VectorVest Options Analyzer
- VectorVest ProGraphics v6.0
- VectorVest ProTrader 7
- VectorVest RealTime Derby Tool
- VectorVest Simulator
- VectorVest Variator
- VectorVest Watchdog
