HOT TOPICS LIST
- MACD
- Fibonacci
- RSI
- Gann
- ADXR
- Stochastics
- Volume
- Triangles
- Futures
- Cycles
- Volatility
- ZIGZAG
- MESA
- Retracement
- Aroon
INDICATORS LIST
LIST OF TOPICS
PRINT THIS ARTICLE
by Jason Braswell
Gas bottomed out at $5.06 a few months back and is currently trading in the mid $6 range. It looks like gas may have topped out, but where will it go?
Position: Sell
Jason Braswell
Jason Braswell is the Director of Risk Management Services for Infinite Consulting, LLC. He attended graduate school for mathematics at the University of Florida in Gainesville and is an MTA affiliate.
PRINT THIS ARTICLE
TRIANGLES
NYMEX Natural Gas
05/20/04 10:21:21 AMby Jason Braswell
Gas bottomed out at $5.06 a few months back and is currently trading in the mid $6 range. It looks like gas may have topped out, but where will it go?
Position: Sell
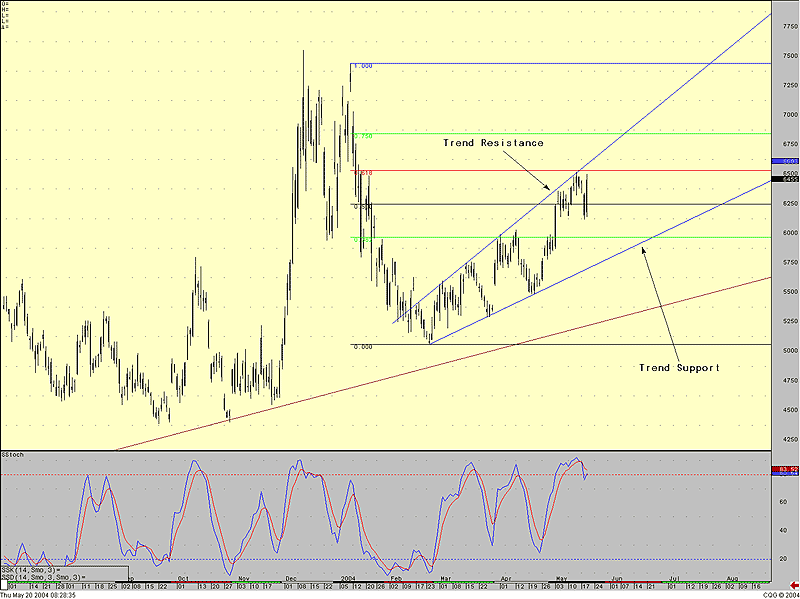
| As you can see below on the pit daily continuation chart for NYMEX natural gas, prices have risen inside of an expanding triangle pattern since bottoming out in February at $5.06. Gas hit $6.53 last week on worries of the erupting crude market, testing the upper trendline of the pattern. Additionally, prices also tested the 61.8% retracement level for the move from $7.44 on January 9th down to the aforementioned low of $5.06 on February 24th. Combined with waning momentum, indicated by the overbought signal on the slow stochastic - I find that (14,3,3) parameters work well for this market - we're likely to see a test of the bottom trendline over the next couple of weeks, which should be down in the high $5 range. |

|
| Figure 1: Daily chart for NG. |
| Graphic provided by: CQG. |
| |
| What happens when this support is tested? Will it break through or bounce off yet again? My guess is the former. First, trend resistance and trend support have been tested eight times now, which is a lot of activity for this pattern. Second, given that this pattern, an upward tilting expanding triangle, is generally bearish, I expect a break to the bottom. If prices bounce off of the floor yet again and return to the upper trendline, the likely peak of that move would be well beyond the 61.8% retracement zone and quite probably above the less often used 75% retracement level. In such an instance, I would be hard-pressed to view this move as a retracement. |
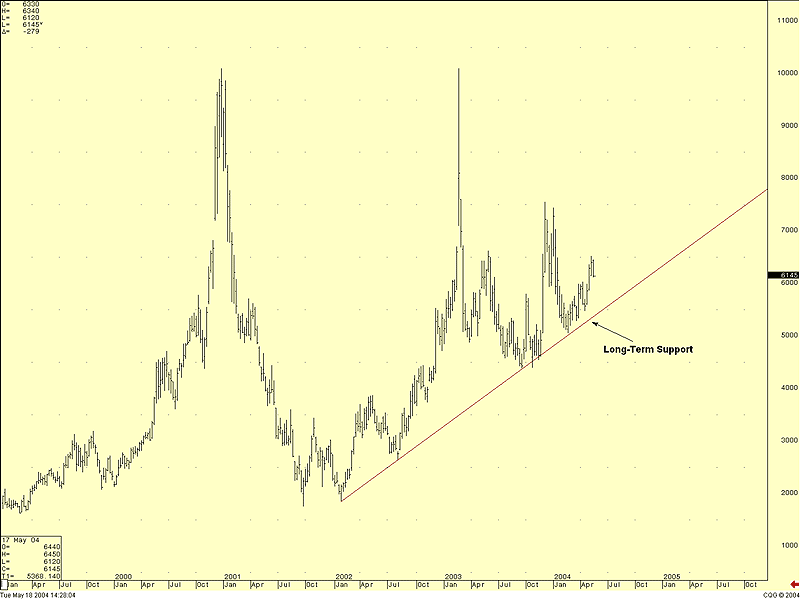
 Figure 2: Weekly chart for NG. Measuring the width of the triangle from the point of the anticipated breakout gives about $0.70 of movement, implying a price target of about $5.10. Such a move means gas would settle below much longer-term support, shown clearly on the weekly chart. This could precipitate a far more substantial move down, and indeed, I expect prices to reach below the late 2003 low of $4.39 as part of a large downtrend, originating from the $10.10 high on February 25, 2003, sometime this summer. |
Jason Braswell is the Director of Risk Management Services for Infinite Consulting, LLC. He attended graduate school for mathematics at the University of Florida in Gainesville and is an MTA affiliate.
| Company: | Infinite Consulting, LLC |
| Website: | www.infiniteconsulting.org |
| E-mail address: | jbraswell@infiniteconsulting.org |
Traders' Resource Links | |
| Infinite Consulting, LLC has not added any product or service information to TRADERS' RESOURCE. | |
Click here for more information about our publications!
Comments
Date: 05/21/04Rank: 5Comment:
Date: 05/25/04Rank: 3Comment:

Request Information From Our Sponsors
- VectorVest, Inc.
- Executive Premier Workshop
- One-Day Options Course
- OptionsPro
- Retirement Income Workshop
- Sure-Fire Trading Systems (VectorVest, Inc.)
- Trading as a Business Workshop
- VectorVest 7 EOD
- VectorVest 7 RealTime/IntraDay
- VectorVest AutoTester
- VectorVest Educational Services
- VectorVest OnLine
- VectorVest Options Analyzer
- VectorVest ProGraphics v6.0
- VectorVest ProTrader 7
- VectorVest RealTime Derby Tool
- VectorVest Simulator
- VectorVest Variator
- VectorVest Watchdog
- StockCharts.com, Inc.
- Candle Patterns
- Candlestick Charting Explained
- Intermarket Technical Analysis
- John Murphy on Chart Analysis
- John Murphy's Chart Pattern Recognition
- John Murphy's Market Message
- MurphyExplainsMarketAnalysis-Intermarket Analysis
- MurphyExplainsMarketAnalysis-Visual Analysis
- StockCharts.com
- Technical Analysis of the Financial Markets
- The Visual Investor
