HOT TOPICS LIST
- MACD
- Fibonacci
- RSI
- Gann
- ADXR
- Stochastics
- Volume
- Triangles
- Futures
- Cycles
- Volatility
- ZIGZAG
- MESA
- Retracement
- Aroon
INDICATORS LIST
LIST OF TOPICS
PRINT THIS ARTICLE
by Koos van der Merwe
Newmont Mining is regarded as one of the premium mining stocks. It is beginning to show some very interesting chart patterns. Is this a prelude to a rise in gold prices?
Position: Accumulate
Koos van der Merwe
Has been a technical analyst since 1969, and has worked as a futures and options trader with First Financial Futures in Johannesburg, South Africa.
PRINT THIS ARTICLE
CHART ANALYSIS
Is Newmont Mining Leading The Gold Price?
05/24/04 01:57:00 PMby Koos van der Merwe
Newmont Mining is regarded as one of the premium mining stocks. It is beginning to show some very interesting chart patterns. Is this a prelude to a rise in gold prices?
Position: Accumulate
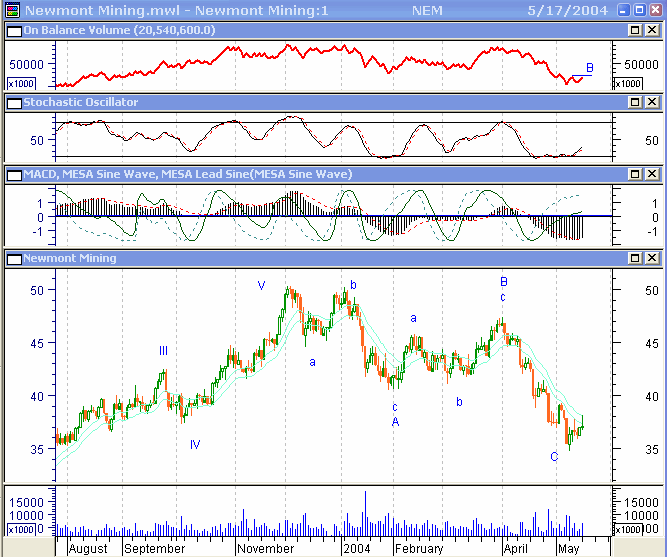
| The chart below looks rather complicated. On it I have shown a number of indicators that could suggest where the share price is headed. I have not duplicated any indicators. For example, out a number of oscillators, such as the stochastic, RSI and rate of change, I have chosen a simple stochastic indicator. I'm also using a MACD indicator, arguably an oscillator because it consists of one moving average subtracted from another, but the MACD is a delayed indicator and always acts as confirmation. |
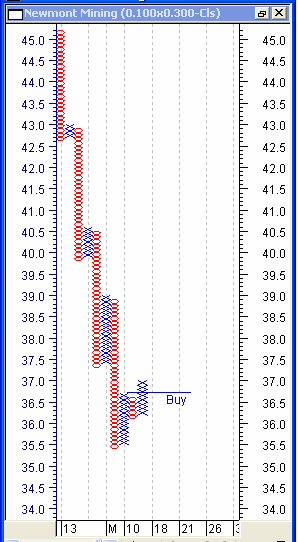
| Starting from the top, the chart shows the following: 1. The on-balance volume indicator developed by Joseph Granville. This indicator is in everyone's armory, and is very useful as a suggestion of where volume suggests a price scan move. In the chart, a break above the horizontal line at "B" would be a buy. 2. A stochastic oscillator with the parameters 8,10,3. This oscillator is oversold and is suggesting a buy. 3. The third window has two indicators. The histogram is the MACD indicator, which is also starting to turn up suggesting a buy. I have found that when the MACD and stochastic confirm each other, then it is a sign that the price could turn. 4. The second indicator in the third window, is John Ehler's MESA. This is a cyclical indicator, based on moving averages. Ehlers developed it when floppys were the only disks available. Yet it is still well thought of and very conducive to forecasting a price move, although it is somewhat early. However, I have learned never to trade against its trend and in the chart, it is rising. If I own the stock and MESA has given a sell signal, I will continue to hold the stock but will look for a sell signal on the stochastic, RSI, or any other indicator of choice. 5. The chart of the share price. I have indicated a possible Wave count, which shows that a C wave of an ABC decline has been completed. This means that we can now expect a wave 1 up, and wave 2 down, which could be, and usually is, a 72% retracement. The chart also shows a JM internal moving average band. This is a 15-period moving average offset vertically by 1% and -1%. The price at the moment is "kissing" the upper band line, but has not confirmed a buy signal. 6. Volume, after showing strength as the share price fell, is starting to pick up as the share price rises, also suggesting strength. 7. Finally, the point and figure chart has given a buy signal by breaking above the horizontal line drawn from the top of a row of "X's". A vertical target count suggests the price could rise to $39.95. (there are 10 x's in the column, and a 3-point reversal with a box size of 0.10 (10 x 3 = 30 x 0.1 = 3. $36.95 + 3 = $39.95). A horizontal target count , my preferred count, gives me a target of $38.15 (4 columns x 3 point reversal = 12 x 0.10 the box size = 1.2 added to $36.95 = $38.15). |

|
| Figure 1: Newmont Mining analyzed. |
| Graphic provided by: MetaStock. |
| |
 Figure 2: Point and figure chart of Newmont Mining Co. To conclude, all the indicators are suggesting a move up in the stock price. If so, this could only mean that the gold price will now start rising as well as the share price has moved in tandem with the movement in gold. |
Has been a technical analyst since 1969, and has worked as a futures and options trader with First Financial Futures in Johannesburg, South Africa.
| Address: | 3256 West 24th Ave |
| Vancouver, BC | |
| Phone # for sales: | 6042634214 |
| E-mail address: | petroosp@gmail.com |
Click here for more information about our publications!
Comments
Date: 05/24/04Rank: 5Comment:
Date: 05/25/04Rank: 3Comment:
Date: 05/25/04Rank: 5Comment:

Request Information From Our Sponsors
- StockCharts.com, Inc.
- Candle Patterns
- Candlestick Charting Explained
- Intermarket Technical Analysis
- John Murphy on Chart Analysis
- John Murphy's Chart Pattern Recognition
- John Murphy's Market Message
- MurphyExplainsMarketAnalysis-Intermarket Analysis
- MurphyExplainsMarketAnalysis-Visual Analysis
- StockCharts.com
- Technical Analysis of the Financial Markets
- The Visual Investor
- VectorVest, Inc.
- Executive Premier Workshop
- One-Day Options Course
- OptionsPro
- Retirement Income Workshop
- Sure-Fire Trading Systems (VectorVest, Inc.)
- Trading as a Business Workshop
- VectorVest 7 EOD
- VectorVest 7 RealTime/IntraDay
- VectorVest AutoTester
- VectorVest Educational Services
- VectorVest OnLine
- VectorVest Options Analyzer
- VectorVest ProGraphics v6.0
- VectorVest ProTrader 7
- VectorVest RealTime Derby Tool
- VectorVest Simulator
- VectorVest Variator
- VectorVest Watchdog
