HOT TOPICS LIST
- MACD
- Fibonacci
- RSI
- Gann
- ADXR
- Stochastics
- Volume
- Triangles
- Futures
- Cycles
- Volatility
- ZIGZAG
- MESA
- Retracement
- Aroon
INDICATORS LIST
LIST OF TOPICS
PRINT THIS ARTICLE
by Koos van der Merwe
The policy of this Fund is to provide investors with a stable monthly distribution out of current income, supplemented by realized capital gains and, to the extent necessary, paid-in capital. The Board intends to maintain a monthly distribution of US 3.5 cents per share for 12 months, beginning with the July 11, 2003 distribution payment. This policy is subject to regular review at the Board's quarterly meetings. The fund's next review is scheduled to take place in June 2004.
Position: Accumulate
Koos van der Merwe
Has been a technical analyst since 1969, and has worked as a futures and options trader with First Financial Futures in Johannesburg, South Africa.
PRINT THIS ARTICLE
CUP WITH HANDLE
Analyzing Aberdeen Asia Pacific Prime Income Fund Inc.
05/24/04 09:21:28 AMby Koos van der Merwe
The policy of this Fund is to provide investors with a stable monthly distribution out of current income, supplemented by realized capital gains and, to the extent necessary, paid-in capital. The Board intends to maintain a monthly distribution of US 3.5 cents per share for 12 months, beginning with the July 11, 2003 distribution payment. This policy is subject to regular review at the Board's quarterly meetings. The fund's next review is scheduled to take place in June 2004.
Position: Accumulate
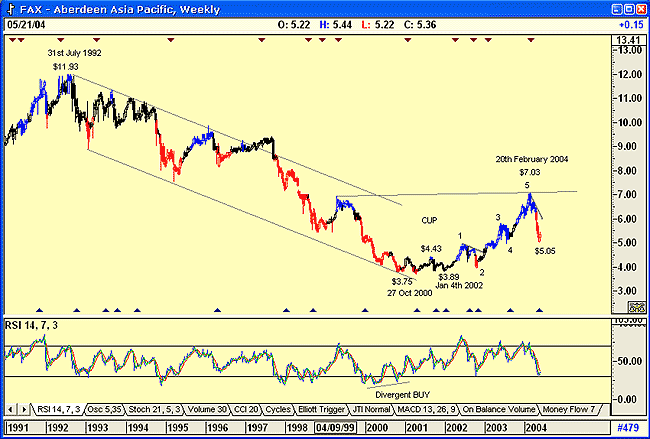
| Below is a weekly chart of Aberdeen Asian Pacific (FAX). On it you can see how the share price peaked at $11.93 on July 31, 1992. Since that date, and over the length of the bull market, the share price fell with the rise in interest rates, to reach a low of $3.75 on October 27, 2000. At this date, the RSI indicator gave a divergence "buy" signal. The share price rose to $4.43 but then fell to $3.89, forming a triple bottom formation on January 4th, 2002, a very strong support level. |
| From January 4th, the share price rose in a 5-wave formation to a high of $7.03 by February 20, 2004. The rise was in a low interest rate environment as investors looked for a good return on investment as well as growth. The dividend paid at the moment (May 19, 2004) is $0.04 per share. With the share price presently at $5.34 this gives a yearly yield of 8.99%... not bad in today's low interest rate environment. |

|
| The weekly chart of Aberdeen Asia Pacific. |
| Graphic provided by: AdvancedGET. |
| |
| The weekly chart has also formed what appears to be a cup and handle formation. The recent fall in price came when Alan Greenspan hinted at a future rise in rates as the economy in the United States improved. The question is: Will the price rise to break above the handle formation of the cup, offering investors capital growth along with a good yield? The RSI indicator is suggesting the price could be oversold. Then, of course, investors must be aware that the dividend paid is not cast in stone. |
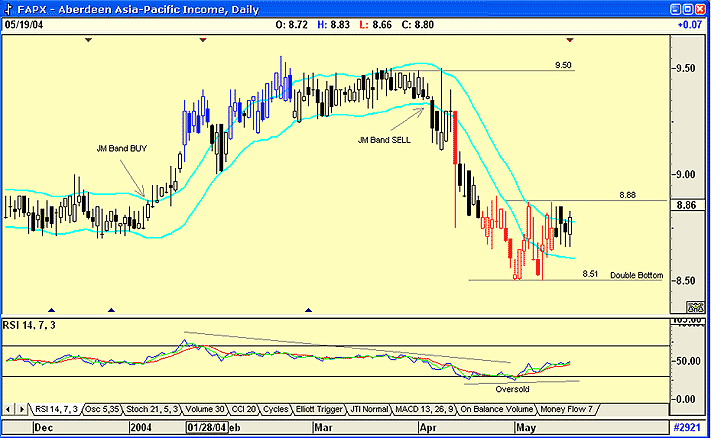
 Daily chart of FAX. In an attempt to answer these questions, I've noted the following on FAX's daily chart. 1.The price appears to have formed a double bottom at $8.51. This, with an RSI indicator rising, is suggesting strength. 2. I have included a JM internal band. This is a 15-period simple moving average offset, in the case of FAX, by 1% and -1%. The price has broken the upper band line, suggesting a "buy" signal. (Note how the price gave a buy signal as it broke above the upper band line, and how it gave a sell signal when it broke below the band line. In between, it used the upper/lower band lines as resistance and support levels.) 3. Finally, the price is flirting with the upper band line, suggesting a buy signal. There is also resistance at $8.88, followed by the handle resistance of the cup and handle formation on the weekly chart at $9.50. |
| Once again there is the question: Why should the share price rise if rates are on the way up? A possible answer is that the price is presently oversold and rates may not rise as quickly as forecast. This could occur if the market moves into the four year bear trend long-term charts of the indexes are suggesting. |
Has been a technical analyst since 1969, and has worked as a futures and options trader with First Financial Futures in Johannesburg, South Africa.
| Address: | 3256 West 24th Ave |
| Vancouver, BC | |
| Phone # for sales: | 6042634214 |
| E-mail address: | petroosp@gmail.com |
Click here for more information about our publications!
Comments
Date: 05/25/04Rank: 5Comment:

|

Request Information From Our Sponsors
- StockCharts.com, Inc.
- Candle Patterns
- Candlestick Charting Explained
- Intermarket Technical Analysis
- John Murphy on Chart Analysis
- John Murphy's Chart Pattern Recognition
- John Murphy's Market Message
- MurphyExplainsMarketAnalysis-Intermarket Analysis
- MurphyExplainsMarketAnalysis-Visual Analysis
- StockCharts.com
- Technical Analysis of the Financial Markets
- The Visual Investor
- VectorVest, Inc.
- Executive Premier Workshop
- One-Day Options Course
- OptionsPro
- Retirement Income Workshop
- Sure-Fire Trading Systems (VectorVest, Inc.)
- Trading as a Business Workshop
- VectorVest 7 EOD
- VectorVest 7 RealTime/IntraDay
- VectorVest AutoTester
- VectorVest Educational Services
- VectorVest OnLine
- VectorVest Options Analyzer
- VectorVest ProGraphics v6.0
- VectorVest ProTrader 7
- VectorVest RealTime Derby Tool
- VectorVest Simulator
- VectorVest Variator
- VectorVest Watchdog
