HOT TOPICS LIST
- MACD
- Fibonacci
- RSI
- Gann
- ADXR
- Stochastics
- Volume
- Triangles
- Futures
- Cycles
- Volatility
- ZIGZAG
- MESA
- Retracement
- Aroon
INDICATORS LIST
LIST OF TOPICS
PRINT THIS ARTICLE
by Gary Grosschadl
TELUS Corp., the largest telecommunications company in Western Canada and the second largest in the country is looking very top heavy.
Position: Sell
Gary Grosschadl
Independent Canadian equities trader and technical analyst based in Peterborough
Ontario, Canada.
PRINT THIS ARTICLE
CHART ANALYSIS
Canadian Telecomunications Giant Looks Topped Out
05/19/04 04:03:23 PMby Gary Grosschadl
TELUS Corp., the largest telecommunications company in Western Canada and the second largest in the country is looking very top heavy.
Position: Sell
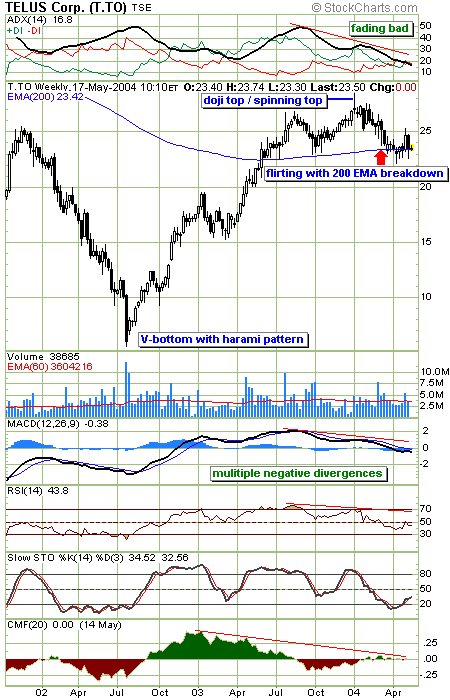
| The weekly chart for Telus seems to bring clarity to the stock's outlook. It is always wise to consider long-term charts as sometimes the bigger picture brings a better focus. In this case the weekly chart shows potential weakness that could entail a sizable correction. |
| The first sign of topping danger came early in the year with a candlestick warning. Whether you call it a doji or a spinning top, both can warn of a change in bullish momentum or that a stock is reaching a topping phase. The ideal doji has the same open and close but this is close enough for many candlestick traders to take heed. An argument for a spinning top can also be made but again it is not the classic looking formation with a diminutive body and fairly equal upper and lower shadows. Either formation suggests a change in bullish momentum, which often results in establishing a top. |

|
| Weekly chart for Telus Corp. |
| Graphic provided by: Stockcharts.com. |
| |
| In a side note, another candlestick pattern is worth mentioning - a harami pattern. This occured at the V-bottom with a bearish bottoming candlestick followed by a (bullishly white) candlestick contained within. This indicates a halt in bearish momentum, resulting in a reversal pattern or a drift sideways. Many traders consider V-bottoms unreliable but this was not the case here as a very good upleg developed. |
| The other danger sign is that the stock is flirting with an important and often watched level - the 200-period moving average, in this case the EMA (exponential moving average), which I prefer over the SMA (simple moving average). When there is not a clean or definitive bounce off this key level, I begin to suspect a coming failure. Several displayed indicators such as the MACD (moving average convergence/divergence) and the RSI (relative strength index) also hint at downside implications. Note the negative divergences on these indicators. As the stock headed higher, these indicators refused to do likewise. This is often a precurser to downside movement. |
| A surprise move above $25 would negate these bearish concerns for now but a move south of the 200-week EMA, currently at $23.42, could mark a swift decline. Downside targets would likely be $20 and then $15-$17, a previous congestion zone. |
Independent Canadian equities trader and technical analyst based in Peterborough
Ontario, Canada.
| Website: | www.whatsonsale.ca/financial.html |
| E-mail address: | gwg7@sympatico.ca |
Click here for more information about our publications!
Comments

Request Information From Our Sponsors
- StockCharts.com, Inc.
- Candle Patterns
- Candlestick Charting Explained
- Intermarket Technical Analysis
- John Murphy on Chart Analysis
- John Murphy's Chart Pattern Recognition
- John Murphy's Market Message
- MurphyExplainsMarketAnalysis-Intermarket Analysis
- MurphyExplainsMarketAnalysis-Visual Analysis
- StockCharts.com
- Technical Analysis of the Financial Markets
- The Visual Investor
- VectorVest, Inc.
- Executive Premier Workshop
- One-Day Options Course
- OptionsPro
- Retirement Income Workshop
- Sure-Fire Trading Systems (VectorVest, Inc.)
- Trading as a Business Workshop
- VectorVest 7 EOD
- VectorVest 7 RealTime/IntraDay
- VectorVest AutoTester
- VectorVest Educational Services
- VectorVest OnLine
- VectorVest Options Analyzer
- VectorVest ProGraphics v6.0
- VectorVest ProTrader 7
- VectorVest RealTime Derby Tool
- VectorVest Simulator
- VectorVest Variator
- VectorVest Watchdog
