HOT TOPICS LIST
- MACD
- Fibonacci
- RSI
- Gann
- ADXR
- Stochastics
- Volume
- Triangles
- Futures
- Cycles
- Volatility
- ZIGZAG
- MESA
- Retracement
- Aroon
INDICATORS LIST
LIST OF TOPICS
PRINT THIS ARTICLE
by Ashwani Gujral
Financial stocks are generally the first casualty of rising interest rates. Citigroup's (C) chart has broken down from a broadening top and is likely to see lower levels in the days to come.
Position: N/A
Ashwani Gujral
He is founder of AGIP Securities Pvt. Ltd. which offers money management services, live chat rooms (during market hours) and independent technical analysis consultancy. The company has a big media presence from the likes of CNBC, NDTV Profit, and ZEE Business.
PRINT THIS ARTICLE
BROADENING FORMATION
Citigroup Breaks Down From A Broadening Top
05/20/04 11:33:46 AMby Ashwani Gujral
Financial stocks are generally the first casualty of rising interest rates. Citigroup's (C) chart has broken down from a broadening top and is likely to see lower levels in the days to come.
Position: N/A
| Financial stocks, particularly banking stocks, rise as interest rates start declining and start declining as interest rates start going up. Most banking institutions hold bond portfolios that have been acquired at low interest rates, and when interest rates start rising, the bonds begin losing value. This is then factored into valuation of banking stocks. The same is true of the declining interest rate scenario. As interest rates decline, bond portfolios become more valuable. This is one of the important factors influencing the stock price of banks. |
| Banking stocks usually move in a largish range. They are at the bottom of this range when interest rates start declining and at the top when they start rising. This is another intermarket relationship. |

|
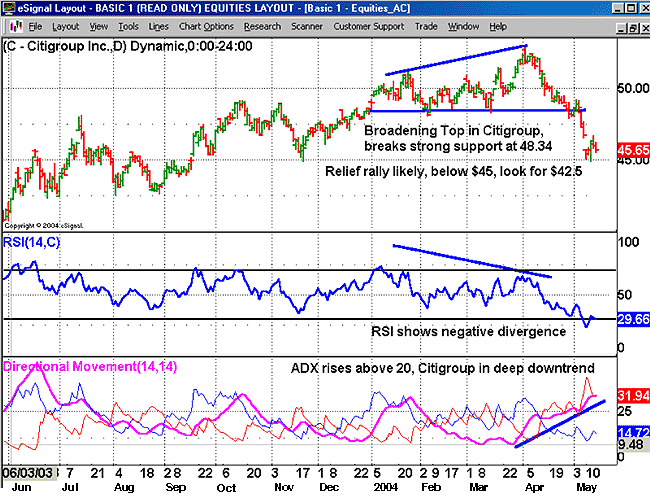
| Figure 1: Daily chart of Citigroup. |
| Graphic provided by: eSignal. |
| |
| On the daily chart, Citigroup has formed a broadening formation. The broadening formation most often occurs when the market is in an extreme overbought stage. At this point, the market is making new highs as the momentum is slowing down. This is shown by the negative divergence in the RSI. The ADX, which was in consolidation mode, started trending as soon as the stock gathered downside momentum. The target of a broadening formation is calculated by extrapolating its width below the flat line. The Citigroup chart gives a target of: $48 - $3 = $45. |
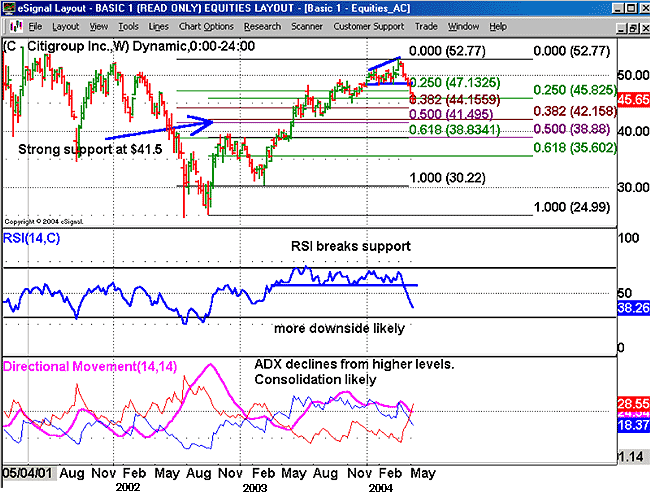
 Figure 2: Weekly chart of Citigroup. On the weekly chart, Citigroup has broken through several critical supports. I've used eSignal's Fibonacci tool to calculate the retracement from two different lows to the high, and found a level of confluence at $41.5. This level is expected to provide strong support to the stock. The RSI has also broken down from its historic support levels and indicates more downside. The ADX is in consolidation mode declining from higher levels. It is likely to rise once the downtrend gathers steam. |
| To summarize, interest rate cycles have several intermarket relationships and it is useful to keep them in mind when interest rate cycles are getting priced into stock, commodity and currency markets. |
He is founder of AGIP Securities Pvt. Ltd. which offers money management services, live chat rooms (during market hours) and independent technical analysis consultancy. The company has a big media presence from the likes of CNBC, NDTV Profit, and ZEE Business.
| Title: | Chief mkt strategist |
| Company: | AGIP Securities |
| India | |
| Phone # for sales: | 9871066337 |
| Website: | www.ashwanigujral.com |
| E-mail address: | contact@ashwanigujral.com |
Traders' Resource Links | |
| AGIP Securities has not added any product or service information to TRADERS' RESOURCE. | |
Click here for more information about our publications!
PRINT THIS ARTICLE

Request Information From Our Sponsors
- VectorVest, Inc.
- Executive Premier Workshop
- One-Day Options Course
- OptionsPro
- Retirement Income Workshop
- Sure-Fire Trading Systems (VectorVest, Inc.)
- Trading as a Business Workshop
- VectorVest 7 EOD
- VectorVest 7 RealTime/IntraDay
- VectorVest AutoTester
- VectorVest Educational Services
- VectorVest OnLine
- VectorVest Options Analyzer
- VectorVest ProGraphics v6.0
- VectorVest ProTrader 7
- VectorVest RealTime Derby Tool
- VectorVest Simulator
- VectorVest Variator
- VectorVest Watchdog
- StockCharts.com, Inc.
- Candle Patterns
- Candlestick Charting Explained
- Intermarket Technical Analysis
- John Murphy on Chart Analysis
- John Murphy's Chart Pattern Recognition
- John Murphy's Market Message
- MurphyExplainsMarketAnalysis-Intermarket Analysis
- MurphyExplainsMarketAnalysis-Visual Analysis
- StockCharts.com
- Technical Analysis of the Financial Markets
- The Visual Investor
