HOT TOPICS LIST
- MACD
- Fibonacci
- RSI
- Gann
- ADXR
- Stochastics
- Volume
- Triangles
- Futures
- Cycles
- Volatility
- ZIGZAG
- MESA
- Retracement
- Aroon
INDICATORS LIST
LIST OF TOPICS
PRINT THIS ARTICLE
by Kevin Hopson
A successful breach of resistance could spur a significant rally in natural gas prices.
Position: Hold
Kevin Hopson
Kevin has been a technical analyst for roughly 10 years now. Previously, Kevin owned his own business and acted as a registered investment advisor, specializing in energy. He was also a freelance oil analyst for Orient Trading Co., a commodity futures trading firm in Japan. Kevin is currently a freelance writer.
PRINT THIS ARTICLE
TECHNICAL ANALYSIS
Natural Gas Approaching Key Resistance
05/17/04 08:47:43 AMby Kevin Hopson
A successful breach of resistance could spur a significant rally in natural gas prices.
Position: Hold
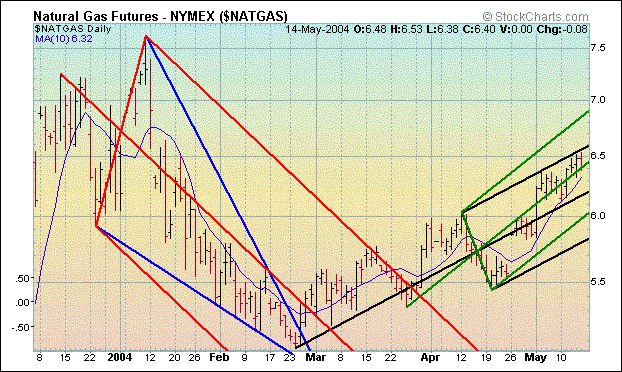
| The last time I touched on natural gas was in mid-March. At that time, I mentioned how the $5.80 level was acting as a temporary barrier for prices, as this was the site of the continuous contract's 50-day moving average ($5.77) and January's downtrend line. A break of resistance here would have signaled a short-term trend change and a significant move higher. As you can see in the six-month chart, natural gas broke out of its short-term downtrend in late March, as illustrated by the red pitchfork. |
| More specifically, prices bumped up against the top red parallel line, hugged this trendline on the way down and then proceeded to move higher again. Since then, the contract has been in a nice steady uptrend, using the rising 10-day moving average ($6.32) to propel it higher in the last few weeks. However, natural gas continues to find resistance along the top black parallel line, which is now converging around the $6.60 level. Additionally, the 61.8 percent retracement ($6.65) from the January high to the February low comes into play just above this level. |

|
| Graphic provided by: Stockcharts.com. |
| |
| Natural gas is now approaching key resistance levels. If the contract can successfully breach resistance in the $6.60 to $6.65 range, it would signal a continuation of the long-term uptrend. This means that natural gas could see a minimum move up to the $6.90 level - the site of the top green parallel line. Also, a test of January's high ($7.60+) would be possible longer-term goal. This being the case, I would continue to hold and look to go long on a breakout above the $6.65 level. |
Kevin has been a technical analyst for roughly 10 years now. Previously, Kevin owned his own business and acted as a registered investment advisor, specializing in energy. He was also a freelance oil analyst for Orient Trading Co., a commodity futures trading firm in Japan. Kevin is currently a freelance writer.
| Glen Allen, VA | |
| E-mail address: | hopson_1@yahoo.com |
Click here for more information about our publications!
Comments
Date: 05/20/04Rank: 2Comment:

Request Information From Our Sponsors
- VectorVest, Inc.
- Executive Premier Workshop
- One-Day Options Course
- OptionsPro
- Retirement Income Workshop
- Sure-Fire Trading Systems (VectorVest, Inc.)
- Trading as a Business Workshop
- VectorVest 7 EOD
- VectorVest 7 RealTime/IntraDay
- VectorVest AutoTester
- VectorVest Educational Services
- VectorVest OnLine
- VectorVest Options Analyzer
- VectorVest ProGraphics v6.0
- VectorVest ProTrader 7
- VectorVest RealTime Derby Tool
- VectorVest Simulator
- VectorVest Variator
- VectorVest Watchdog
- StockCharts.com, Inc.
- Candle Patterns
- Candlestick Charting Explained
- Intermarket Technical Analysis
- John Murphy on Chart Analysis
- John Murphy's Chart Pattern Recognition
- John Murphy's Market Message
- MurphyExplainsMarketAnalysis-Intermarket Analysis
- MurphyExplainsMarketAnalysis-Visual Analysis
- StockCharts.com
- Technical Analysis of the Financial Markets
- The Visual Investor
