HOT TOPICS LIST
- MACD
- Fibonacci
- RSI
- Gann
- ADXR
- Stochastics
- Volume
- Triangles
- Futures
- Cycles
- Volatility
- ZIGZAG
- MESA
- Retracement
- Aroon
INDICATORS LIST
LIST OF TOPICS
PRINT THIS ARTICLE
by Gary Grosschadl
Three strikes and you're out. Could this be the fate for the Nasdaq?
Position: Sell
Gary Grosschadl
Independent Canadian equities trader and technical analyst based in Peterborough
Ontario, Canada.
PRINT THIS ARTICLE
CHART ANALYSIS
Three Red Flags For The Nasdaq Index
05/17/04 10:37:24 AMby Gary Grosschadl
Three strikes and you're out. Could this be the fate for the Nasdaq?
Position: Sell
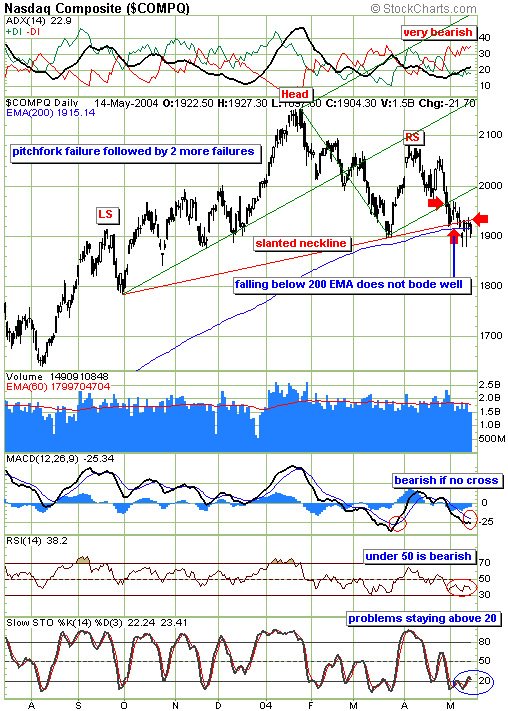
| This daily chart covering ten months shows a possible head and shoulders topping formation. But this isn't the first warning sign for the Nasdaq. The first red flag was a fallout of the bullish pitchfork as shown by the first red arrow. A weak bounce soon followed but the move wilted at the pitchfork's lower median line. This led to the neckline failure of the head and shoulders top. |
| Now to make matters worse, the third red flag appeared last week. This was the violation of the 200-day EMA (exponential moving average). An EMA is similar to a simple moving average but weighted more toward recent action. The 200-period moving average is often a key and telling line of support or resistance for many time frames, including intraday charts. This combination of the neckline and the 200-period EMA had the potential of acting as a confluence of support but instead the index closed below both twice last week, including Friday's close of 1904.30. |

|
| The Nasdaq shows three reasons for concern. |
| Graphic provided by: Stockcharts.com. |
| |
| Several indicators are worth consideration. The uppermost graph shows a very bearish set-up with the ADX rising sharply between the DIs. This shows bearish trend strength growing. The MACD (moving average convergence/divergence) shows bearish forces prevailing with the MACD line under its signal line. For a sustainable bounce there must be a bullish crossover of these lines similar to the previous occasion. Failure of the MACD lines to cross would point to continued market decline. The RSI (relative strength index) shows a bearish bias, being below its key 50 level. The stochastics indicator also reflects poor potential with problems rising and staying above the 20 level. A stochastic downleg starting from this low threshold leaves little optimism. |
| Without an immediate bounce, this index is very likely headed to further downside tests, one of which likely is 1800. Could this be another illustration of how well the pitchfork warns of a tradeable trend change? The next few trading days may give the answer. |
Independent Canadian equities trader and technical analyst based in Peterborough
Ontario, Canada.
| Website: | www.whatsonsale.ca/financial.html |
| E-mail address: | gwg7@sympatico.ca |
Click here for more information about our publications!
Comments
Date: 05/17/04Rank: 5Comment:
Date: 05/17/04Rank: 5Comment:
Date: 05/18/04Rank: 5Comment:
Date: 05/18/04Rank: 2Comment:
Date: 05/18/04Rank: 5Comment:

|

Request Information From Our Sponsors
- StockCharts.com, Inc.
- Candle Patterns
- Candlestick Charting Explained
- Intermarket Technical Analysis
- John Murphy on Chart Analysis
- John Murphy's Chart Pattern Recognition
- John Murphy's Market Message
- MurphyExplainsMarketAnalysis-Intermarket Analysis
- MurphyExplainsMarketAnalysis-Visual Analysis
- StockCharts.com
- Technical Analysis of the Financial Markets
- The Visual Investor
- VectorVest, Inc.
- Executive Premier Workshop
- One-Day Options Course
- OptionsPro
- Retirement Income Workshop
- Sure-Fire Trading Systems (VectorVest, Inc.)
- Trading as a Business Workshop
- VectorVest 7 EOD
- VectorVest 7 RealTime/IntraDay
- VectorVest AutoTester
- VectorVest Educational Services
- VectorVest OnLine
- VectorVest Options Analyzer
- VectorVest ProGraphics v6.0
- VectorVest ProTrader 7
- VectorVest RealTime Derby Tool
- VectorVest Simulator
- VectorVest Variator
- VectorVest Watchdog
