HOT TOPICS LIST
- MACD
- Fibonacci
- RSI
- Gann
- ADXR
- Stochastics
- Volume
- Triangles
- Futures
- Cycles
- Volatility
- ZIGZAG
- MESA
- Retracement
- Aroon
INDICATORS LIST
LIST OF TOPICS
PRINT THIS ARTICLE
by Gary Grosschadl
In less than five months, this former high tech favourite has fallen from a $16 to $10. Where is it headed now?
Position: Hold
Gary Grosschadl
Independent Canadian equities trader and technical analyst based in Peterborough
Ontario, Canada.
PRINT THIS ARTICLE
ANDREWS PITCH-FORK
Siebel Systems' Bearish Slide
05/17/04 08:23:18 AMby Gary Grosschadl
In less than five months, this former high tech favourite has fallen from a $16 to $10. Where is it headed now?
Position: Hold
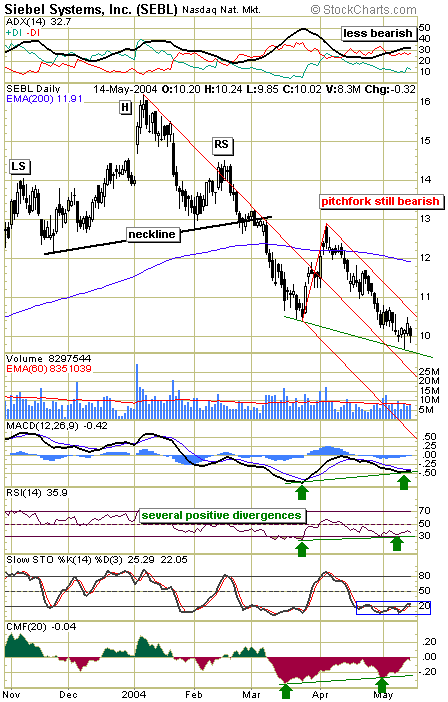
| Siebel's (SEBL) daily chart shows two distinct pattern formations, the first being a head and shoulders failure. There is an interesting observation here - those traders who bailed out of their positions when the neckline was violated on relatively light volume turned out to be correct. The big volume expansion came later as the stock plunged below the 200-day EMA. Typically traders don't trust moves on lighter volumes but the caveat could be that any major pattern failure, in this case the head & shoulders top, should be respected. |
| The second obvious pattern is the bearish pointing Andrews pitchfork. Using the selected three pivot points, the charting software plotted a very telling pitchfork. No doubt some traders were anticipating a possible double bottom attempt two weeks ago, however the move never materialized, and the bearish forces contained in the pitchfork prevailed. This well-established pitchfork becomes an important line of resistance to overcome. Until the upper median line is violated, traders should beware of assuming that there is any tradeable turn in the making. |

|
| There are two distinct patterns on this daily chart. |
| Graphic provided by: Stockcharts.com. |
| |
| On a more positive note, several indicators are looking encouraging. The top graph shows the ADX line possibly topping out above the -DI line. This can be an early indication of bearish forces diminishing. Several lower indicators (highlighted by the green arrows) show a positive divergence to price action. This also may indicate a turn in the making. The stochastics indicator however does not bullishly enthuse, with problems rising and staying above its 20 level. |
| The bottom line is that any move up could be thwarted by the pitchfork's upper median line. The positive divergences previously discussed could be pointing to a short-lived move to test that pitchfork limit. Strong resistance remains in that $10.50 realm, followed by next resistance level at $11. |
Independent Canadian equities trader and technical analyst based in Peterborough
Ontario, Canada.
| Website: | www.whatsonsale.ca/financial.html |
| E-mail address: | gwg7@sympatico.ca |
Click here for more information about our publications!
PRINT THIS ARTICLE

Request Information From Our Sponsors
- StockCharts.com, Inc.
- Candle Patterns
- Candlestick Charting Explained
- Intermarket Technical Analysis
- John Murphy on Chart Analysis
- John Murphy's Chart Pattern Recognition
- John Murphy's Market Message
- MurphyExplainsMarketAnalysis-Intermarket Analysis
- MurphyExplainsMarketAnalysis-Visual Analysis
- StockCharts.com
- Technical Analysis of the Financial Markets
- The Visual Investor
- VectorVest, Inc.
- Executive Premier Workshop
- One-Day Options Course
- OptionsPro
- Retirement Income Workshop
- Sure-Fire Trading Systems (VectorVest, Inc.)
- Trading as a Business Workshop
- VectorVest 7 EOD
- VectorVest 7 RealTime/IntraDay
- VectorVest AutoTester
- VectorVest Educational Services
- VectorVest OnLine
- VectorVest Options Analyzer
- VectorVest ProGraphics v6.0
- VectorVest ProTrader 7
- VectorVest RealTime Derby Tool
- VectorVest Simulator
- VectorVest Variator
- VectorVest Watchdog
