HOT TOPICS LIST
- MACD
- Fibonacci
- RSI
- Gann
- ADXR
- Stochastics
- Volume
- Triangles
- Futures
- Cycles
- Volatility
- ZIGZAG
- MESA
- Retracement
- Aroon
INDICATORS LIST
LIST OF TOPICS
PRINT THIS ARTICLE
by Steven Coffey
Back in early December 2003, Aberdene Mines Ltd. (ABRM) was selling for less than $.50 per share. In just six months, this stock has rocketed to close on Thursday at $4.24. Now it seems to be topping out, and it could make at least a short-term correction.
Position: Sell
Steven Coffey
Steven Coffey is an independent stock trader with a background in Information Systems development and training. He resides in the Boston area.
PRINT THIS ARTICLE
TECHNICAL INDICATORS
Aberdene Mines Ltd. Poised For A Topple
05/17/04 09:07:19 AMby Steven Coffey
Back in early December 2003, Aberdene Mines Ltd. (ABRM) was selling for less than $.50 per share. In just six months, this stock has rocketed to close on Thursday at $4.24. Now it seems to be topping out, and it could make at least a short-term correction.
Position: Sell
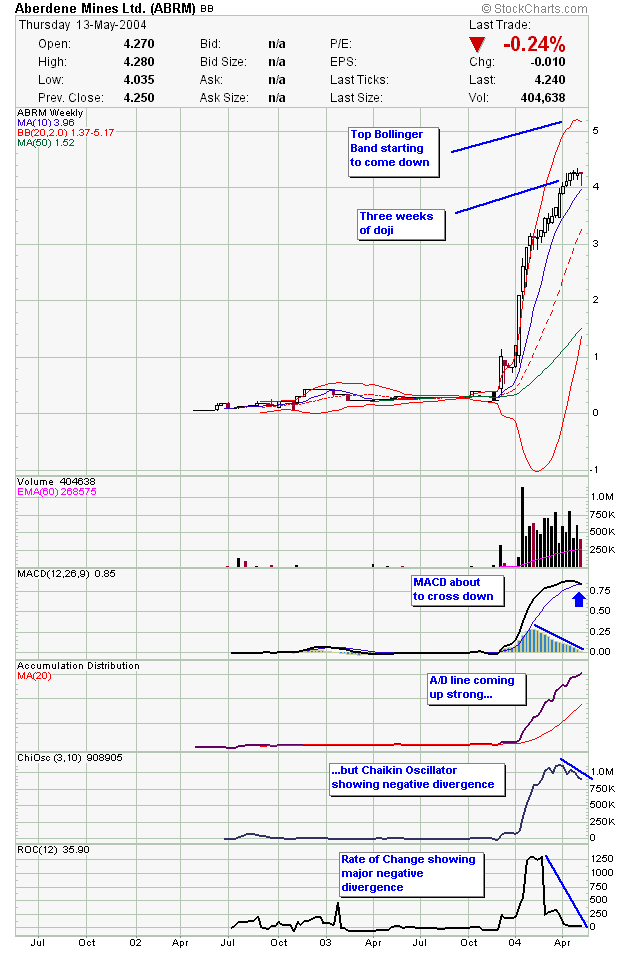
| Looking at the Bollinger Bands on the 3- year weekly chart, you can see that after months of walking up the bands, the price has recently come back inside the bands. Also, the top band is now beginning to come down. This indicates that the volatility is slowing down and that this very powerful uptrend is coming to a halt. |

|
| Figure 1: Weekly chart of Aberdene Mines. |
| Graphic provided by: Stockchart.com. |
| |
| Other signs are the three most recent doji candlestick formations. Doji's are topping out patterns and what's happening here is that each week this stock is closing at roughly the same price it opened. It's not able to make gains anymore. Also, the MACD histogram is coming down sharply, and the MACD is about to cross below the signal line. The rate of change has come down to almost zero. When these oscillators come down and the price hasn't yet, this is what's known as a negative momentum divergence. When this happens, price should follow through in the direction of the divergence. And speaking of divergences, there is another bearish divergence between the accumulation distribution (A/D) line and the Chaikin oscillator. The A/D line shows the balance between buyers and sellers. The Chaikin oscillator is a measurement of this indicator. You can see the A/D line is still coming up strongly, but the Chaikin oscillator has begun to come down. |
| Just as you can expect price to come down shortly after the MACD and rate of change start descending, you can expect the same relationship between the A/D line and the Chaikin oscillator. Since the Chaikin oscillator is beginning its descent, the A/D line should start to do the same soon. When that happens, it will mean that there will be fewer buyers, and that means the price should start coming down. |
| This stock had a good ride up the last six months. But what goes up must come down. ABRM has come up so fast that I don't think it can sustain itself anymore. At the very least, it should consolidate for a while. But whether it's consolidating or coming down, one thing's for sure: it's not going up. So if you own some shares in this company, right now might be a good time to take profits and put your money to work elsewhere. |
Steven Coffey is an independent stock trader with a background in Information Systems development and training. He resides in the Boston area.
| E-mail address: | stevencoffey@yahoo.com |
Click here for more information about our publications!
PRINT THIS ARTICLE

|

Request Information From Our Sponsors
- StockCharts.com, Inc.
- Candle Patterns
- Candlestick Charting Explained
- Intermarket Technical Analysis
- John Murphy on Chart Analysis
- John Murphy's Chart Pattern Recognition
- John Murphy's Market Message
- MurphyExplainsMarketAnalysis-Intermarket Analysis
- MurphyExplainsMarketAnalysis-Visual Analysis
- StockCharts.com
- Technical Analysis of the Financial Markets
- The Visual Investor
- VectorVest, Inc.
- Executive Premier Workshop
- One-Day Options Course
- OptionsPro
- Retirement Income Workshop
- Sure-Fire Trading Systems (VectorVest, Inc.)
- Trading as a Business Workshop
- VectorVest 7 EOD
- VectorVest 7 RealTime/IntraDay
- VectorVest AutoTester
- VectorVest Educational Services
- VectorVest OnLine
- VectorVest Options Analyzer
- VectorVest ProGraphics v6.0
- VectorVest ProTrader 7
- VectorVest RealTime Derby Tool
- VectorVest Simulator
- VectorVest Variator
- VectorVest Watchdog
