HOT TOPICS LIST
- MACD
- Fibonacci
- RSI
- Gann
- ADXR
- Stochastics
- Volume
- Triangles
- Futures
- Cycles
- Volatility
- ZIGZAG
- MESA
- Retracement
- Aroon
INDICATORS LIST
LIST OF TOPICS
PRINT THIS ARTICLE
by Steven Coffey
Plenty of divergences are pointing toward an upswing.
Position: Buy
Steven Coffey
Steven Coffey is an independent stock trader with a background in Information Systems development and training. He resides in the Boston area.
PRINT THIS ARTICLE
CHART ANALYSIS
H&R Block Showing Positive Signs Of Reversal
05/14/04 11:42:58 AMby Steven Coffey
Plenty of divergences are pointing toward an upswing.
Position: Buy
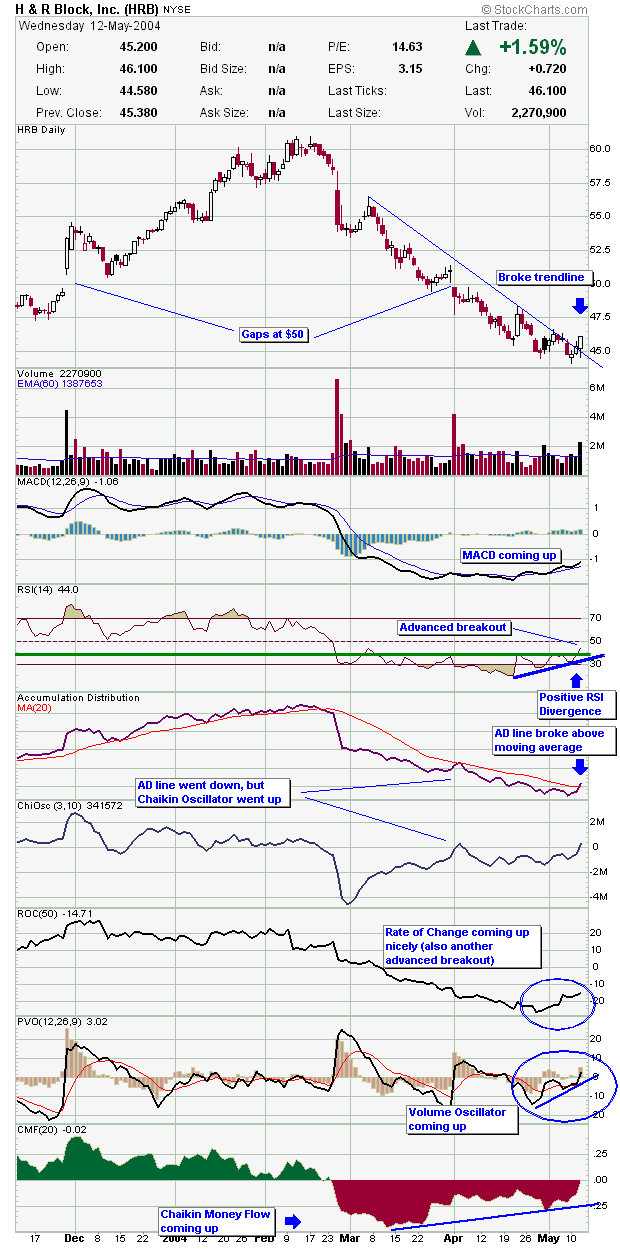
| Right now, H&R Block (HRB) is showing so many signs of an upside reversal, I almost don't know where to begin. Between the break in the 2-month downtrend, bullish divergences all over the place, and a couple of advanced breakouts, this stock looks like a very good buy. |
| First, on Wednesday the volume picked up to its highest point in weeks to propel HRB above its downtrend line that began in March. Next, there are plenty of momentum indicators showing a positive divergence. This happens when these indicators are coming up while the price is still going down or perhaps forming a base. Since momentum tends to lead price, if the momentum oscillators are coming up, price should follow, and that's exactly what's happening with HRB right now. Looking at the chart, you can see the MACD, RSI, accumulation/distribution (A/D), rate of change, and Chaikin money flow are all coming up. So the momentum is turning positive and money now seems to be flowing into this stock. Also note the Chaikin oscillator (ChiOsc on the chart). This indicator is based, not on price, but on the A/D line, and it tends to lead A/D. Since February, the A/D has been coming down while the Chaikin oscillator has been rising. This means the A/D line could start rising (it's already crossed above its moving average), which would indicate this stock being accumulated even more in the near future. |

|
| Figure 1: Daily chart of H&R Block. |
| Graphic provided by: Stockcharts.com. |
| |
| Earlier I mentioned advanced breakouts. These occur when a momentum oscillator reaches a new high before price does. As I said, momentum tends to lead price, so if a momentum indicator is making new highs, this is a bullish signal that the price may begin to rise. Both the RSI and rate of change are exhibiting this pattern on the chart. Finally, the volume oscillator is also coming up. This increase in volume will be necessary to propel the stock higher should it begin to ascend. |
| All of these indicators are very positive. I think HRB could go to $60, which it did in February. However, a word of caution is in order. Note the gaps around the $50 mark. These gaps can serve as resistance points as the stock approaches these levels. So if HRB goes to $50 and starts showing signs of slowing, you may want to take some profits. But as I mentioned, the volume is picking up, so that could very well push HRB above $50, at which point $50 would become support, and the stock could go up from there. |
Steven Coffey is an independent stock trader with a background in Information Systems development and training. He resides in the Boston area.
| E-mail address: | stevencoffey@yahoo.com |
Click here for more information about our publications!
Comments
Date: 05/20/04Rank: 5Comment: I love to read Steven Coffey s article.I found the most useful for trading stock reserach. I hope to continue to read his articles.
Date: 05/20/04Rank: 5Comment: I love to read Steven Coffey s article.I found the most useful for trading stock reserach. I hope to continue to read his articles.

Request Information From Our Sponsors
- StockCharts.com, Inc.
- Candle Patterns
- Candlestick Charting Explained
- Intermarket Technical Analysis
- John Murphy on Chart Analysis
- John Murphy's Chart Pattern Recognition
- John Murphy's Market Message
- MurphyExplainsMarketAnalysis-Intermarket Analysis
- MurphyExplainsMarketAnalysis-Visual Analysis
- StockCharts.com
- Technical Analysis of the Financial Markets
- The Visual Investor
- VectorVest, Inc.
- Executive Premier Workshop
- One-Day Options Course
- OptionsPro
- Retirement Income Workshop
- Sure-Fire Trading Systems (VectorVest, Inc.)
- Trading as a Business Workshop
- VectorVest 7 EOD
- VectorVest 7 RealTime/IntraDay
- VectorVest AutoTester
- VectorVest Educational Services
- VectorVest OnLine
- VectorVest Options Analyzer
- VectorVest ProGraphics v6.0
- VectorVest ProTrader 7
- VectorVest RealTime Derby Tool
- VectorVest Simulator
- VectorVest Variator
- VectorVest Watchdog
