HOT TOPICS LIST
- MACD
- Fibonacci
- RSI
- Gann
- ADXR
- Stochastics
- Volume
- Triangles
- Futures
- Cycles
- Volatility
- ZIGZAG
- MESA
- Retracement
- Aroon
INDICATORS LIST
LIST OF TOPICS
PRINT THIS ARTICLE
by David Penn
The three major averages have all traced out hourly bottoming patterns in the middle of May.
Position: N/A
David Penn
Technical Writer for Technical Analysis of STOCKS & COMMODITIES magazine, Working-Money.com, and Traders.com Advantage.
PRINT THIS ARTICLE
DOUBLE BOTTOMS
Gaming The Mid-May Bounce
05/14/04 11:38:19 AMby David Penn
The three major averages have all traced out hourly bottoming patterns in the middle of May.
Position: N/A
| For weeks the bulls have exhorted investors to keep the faith. After a year of spectacular gains in stocks, it seems like even an overdue correction is too much for some investors to handle. And so the bulls have raced to battle stations to remind investors of the "breakout jobs numbers," the great earnings of the first quarter of 2004, the resilience of the economy in the face of rising interest rates. . . In fact, some of the same bulls who exhorted the Fed to keep the money spigots wide open, interestingly enough, are now taunting the Fed to raise the cash rate. As the saying goes, be careful of what you wish for. Part of the bullish argument in recent days -- as the scandal at Abu Ghraib prison metamorphed in the horror of the videotaped execution of an American businessman in Iraq -- has been that, sooner or later, the market will bottom and that bottom will represent an excellent entry for investors. |
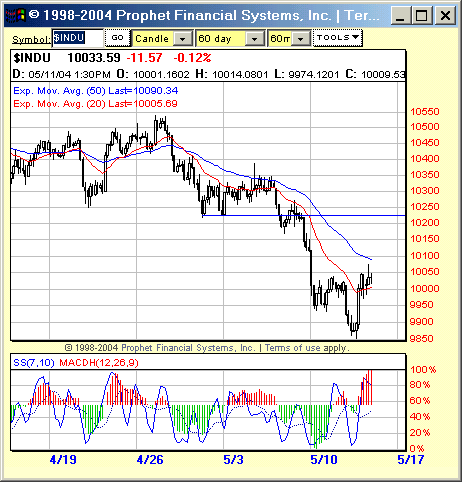
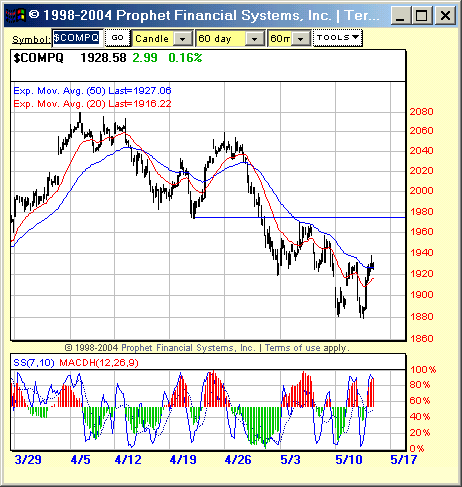
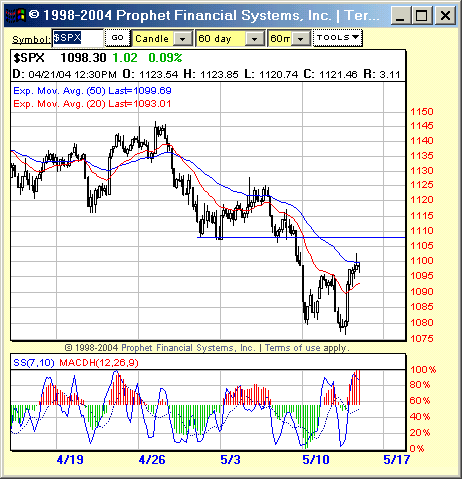
| The first part of this argument is commonsensical. It is hard to argue, especially for those with an understanding of social mood, that the abuse/torture scandal combined with the execution are the kind of things you see at a bottom in social mood, which also strongly suggests a bottom in the market. The second part of the bullish argument, with regard to the quality of the long entry this impending bottom will represent, might be another question altogether. The S&P 500, Dow industrials and Nasdaq have all traced out double bottoms on their hourly charts. Actually, only in the case of the Nasdaq does the action from May 7 to May 13 appear to be a true double bottom. The Dow and S&P 500's bottoming patterns more resemble backwards cup with handle patterns, or head and shoulders bottom with a right shoulder that never developed. |

|
| Figure 1: The Dow Industrials might have plenty of room to the upside before meeting major resistance near 10200. |
| Graphic provided by: Prophet Financial Systems, Inc.. |
| |
 Figure 2: The positive divergence in the MACDH is a bullish sign for the Nasdaq in the near term.  Figure 3: Unlike the Industrials and the Nasdaq, the S&P 500 is already quite close to its key resistance level. In any event, the positive divergences between the twin troughs in each of these three averages -- a positive divergence reflected in both the MACDH (moving average convergence-divergence histogram) and the 7/10 stochastic -- underscores the possibility that the market is making a bottom of some significance. Further, if we invoke Stan Weinstein's swing rule to project an upside -- should prices in all three averages continue to move up above the intra-trough high -- we find that both the Industrials and the Nasdaq fall short of what might be an important previous low. This important low took place at about 10219 on April 29th in the Industrials and at about 1975 on April 21st in the Nasdaq. Swing rule projections for the Industrials and the Nasdaq call for a move to 10176 and 1970, respectively. Why an "important low"? There are two reasons. The first is that the April 29th and 21st lows represent the lows of the previous consolidation as both markets began to break down in April. As such, their lows serve as potential resistance levels to any advance. |
| The second reason is more esoteric. In a Traders.com Advantage article posted April 8, 2004, "The Alternate Wave Count Cometh," I started with the assumption that the markets topped in the first quarter of 2004. From that assumption, I've cast a wave count that remains valid as of this writing. That count has the markets currently in a bearish wave three, with the lows in early May representing a smaller wave three within that larger wave three. For those who pay attention to the nomenclature, call it a minuette third inside a minute third. The key point is that inside the minute third, which began moving downward in late April, that "important low" is a minuette first low. If the early-mid May lows represent minuette third lows, then the coming bounce should be of fourth wave variety. Fine enough, so far. However, insofar as the fourth wave in any five wave sequence cannot enter the territory of the first wave, any "coming bounce" should not rise above 10219 in the Industrials and 1975 in the Nasdaq. Based on Weinstein's swing rule, both averages will fall short. The caveat is the S&P 500. The swing rule here has the S&P 500 indeed bouncing past the "important low" of April (in the case of the S&P 500, that point, the minuette first low, is at 1107), and swinging as high as 1116. Nine points may seem like a quibble. But if the wave count is accurate, then there should be no overlap whatsoever. |
| My suspicion is that the S&P 500 won't make it. There is nothing infallible about Weinstein's swing rule; it is simply a guide as to what to anticipate in the way of a bounce from a significant trough or in the way of a correction from a significant peak. Some technicians use Weinstein's swing rule, but then modify the projection by multiplying it by 0.618 (a Fibonacci ratio). If nothing else, this approach tamps down any outsized expectations for any ensuing move. What is merely suggested here, however, is that the bulls will get their bounce. But it might be some time before they get their bull market back. |
Technical Writer for Technical Analysis of STOCKS & COMMODITIES magazine, Working-Money.com, and Traders.com Advantage.
| Title: | Technical Writer |
| Company: | Technical Analysis, Inc. |
| Address: | 4757 California Avenue SW |
| Seattle, WA 98116 | |
| Phone # for sales: | 206 938 0570 |
| Fax: | 206 938 1307 |
| Website: | www.Traders.com |
| E-mail address: | DPenn@traders.com |
Traders' Resource Links | |
| Charting the Stock Market: The Wyckoff Method -- Books | |
| Working-Money.com -- Online Trading Services | |
| Traders.com Advantage -- Online Trading Services | |
| Technical Analysis of Stocks & Commodities -- Publications and Newsletters | |
| Working Money, at Working-Money.com -- Publications and Newsletters | |
| Traders.com Advantage -- Publications and Newsletters | |
| Professional Traders Starter Kit -- Software | |
Click here for more information about our publications!
Comments
Date: 05/14/04Rank: 5Comment:
Date: 05/17/04Rank: 4Comment:

Request Information From Our Sponsors
- StockCharts.com, Inc.
- Candle Patterns
- Candlestick Charting Explained
- Intermarket Technical Analysis
- John Murphy on Chart Analysis
- John Murphy's Chart Pattern Recognition
- John Murphy's Market Message
- MurphyExplainsMarketAnalysis-Intermarket Analysis
- MurphyExplainsMarketAnalysis-Visual Analysis
- StockCharts.com
- Technical Analysis of the Financial Markets
- The Visual Investor
- VectorVest, Inc.
- Executive Premier Workshop
- One-Day Options Course
- OptionsPro
- Retirement Income Workshop
- Sure-Fire Trading Systems (VectorVest, Inc.)
- Trading as a Business Workshop
- VectorVest 7 EOD
- VectorVest 7 RealTime/IntraDay
- VectorVest AutoTester
- VectorVest Educational Services
- VectorVest OnLine
- VectorVest Options Analyzer
- VectorVest ProGraphics v6.0
- VectorVest ProTrader 7
- VectorVest RealTime Derby Tool
- VectorVest Simulator
- VectorVest Variator
- VectorVest Watchdog
