HOT TOPICS LIST
- MACD
- Fibonacci
- RSI
- Gann
- ADXR
- Stochastics
- Volume
- Triangles
- Futures
- Cycles
- Volatility
- ZIGZAG
- MESA
- Retracement
- Aroon
INDICATORS LIST
LIST OF TOPICS
PRINT THIS ARTICLE
by Koos van der Merwe
Xerox is a company that has been through the worst, and came out smiling. Anne Mulcahy, the company's chief executive, recently made the announcement, ". . . there is no question that we are open to acquisitions. . ." What do our charts say about the company?
Position: Accumulate
Koos van der Merwe
Has been a technical analyst since 1969, and has worked as a futures and options trader with First Financial Futures in Johannesburg, South Africa.
PRINT THIS ARTICLE
TREND-CHANNEL
Xerox Corporation
05/14/04 11:45:48 AMby Koos van der Merwe
Xerox is a company that has been through the worst, and came out smiling. Anne Mulcahy, the company's chief executive, recently made the announcement, ". . . there is no question that we are open to acquisitions. . ." What do our charts say about the company?
Position: Accumulate
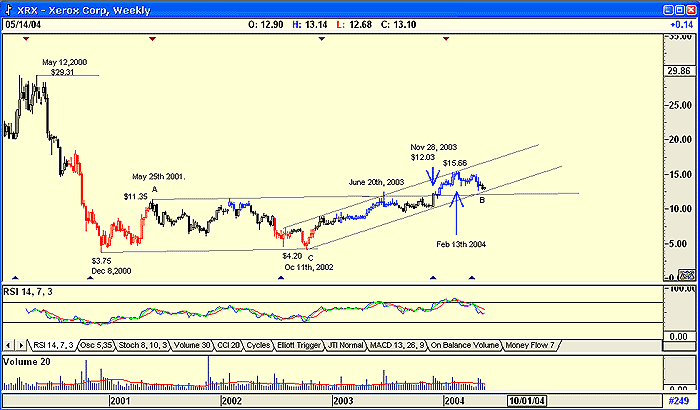
| Figure 1, a weekly chart of Xerox (XRS), shows how the company collapsed from a high of $29.31 on May 12, 2000 to a low of $3.75 on December 8th of the same year, a drop of 87.2% in seven months, enough to dishearten any investor. |

|
| Figure 1: Weekly chart of Xerox. |
| Graphic provided by: AdvancedGET. |
| |
| The share price recovered to $11.35 by May 21,2001, on an RSI indicator buy signal. For the next year, until October 11, 2002, the price traded in the range as outlined on the chart, the RSI trying but not reaching overbought levels. Eventually, on June 20, 2003, it briefly tested the resistance level outlined by A-B, fell back into a sideways pattern, tested it again on November 28th, and broke above it, rising to a high of $15.66 by February 13, 2004 before falling back to test the support line C-B. The negative in this scenario is a downtrending RSI indicator. |
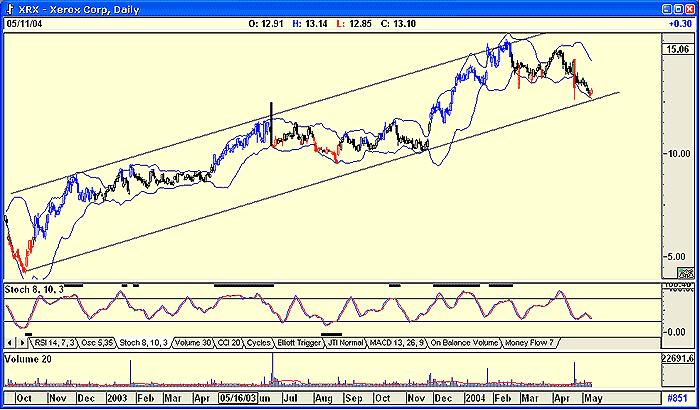
 Figure 2: Daily chart of Xerox. Looking at the daily chart, we see the following. The share price is close to, but not quite on, the support line. The stochastic indicator of my choice is also not oversold, but pretty close to oversold levels. Volume in the past few days has been below average, suggesting possible strength in the near future probably as, and when, the market turns. The colors of the candlesticks in the Advanced GET program that I use in my analysis are also a help in deciding the direction of the trend. The XTL (eXpert Trend Locator ) uses a statistical evaluation of the market that can tell the difference between random market swings (noise) and directed market swings (trends). If the bars are blue, then the trend is up. If the bars are red, then the trend is down. When a bar turns from its normal color to blue or black, you would enter the market when the bar following the Break Out Bar is the same trend color as the Break Out Bar, and the range exceeds 150% of the Break Out Bar in the direction of the trend. At the moment the bar is red, therefore a buy signal has not been suggested. |
| Finally, the price is hugging the lower Bollinger Band, suggesting that an upturn could be imminent, but you should wait for the signal. Xerox is gaining market share in all of its key business segments. Half the company's 2003 revenue has come from products and services developed in the past two years. This company, in my opinion should be seriously considered as a buy once the overall market turns bullish. |
Has been a technical analyst since 1969, and has worked as a futures and options trader with First Financial Futures in Johannesburg, South Africa.
| Address: | 3256 West 24th Ave |
| Vancouver, BC | |
| Phone # for sales: | 6042634214 |
| E-mail address: | petroosp@gmail.com |
Click here for more information about our publications!
PRINT THIS ARTICLE

Request Information From Our Sponsors
- StockCharts.com, Inc.
- Candle Patterns
- Candlestick Charting Explained
- Intermarket Technical Analysis
- John Murphy on Chart Analysis
- John Murphy's Chart Pattern Recognition
- John Murphy's Market Message
- MurphyExplainsMarketAnalysis-Intermarket Analysis
- MurphyExplainsMarketAnalysis-Visual Analysis
- StockCharts.com
- Technical Analysis of the Financial Markets
- The Visual Investor
- VectorVest, Inc.
- Executive Premier Workshop
- One-Day Options Course
- OptionsPro
- Retirement Income Workshop
- Sure-Fire Trading Systems (VectorVest, Inc.)
- Trading as a Business Workshop
- VectorVest 7 EOD
- VectorVest 7 RealTime/IntraDay
- VectorVest AutoTester
- VectorVest Educational Services
- VectorVest OnLine
- VectorVest Options Analyzer
- VectorVest ProGraphics v6.0
- VectorVest ProTrader 7
- VectorVest RealTime Derby Tool
- VectorVest Simulator
- VectorVest Variator
- VectorVest Watchdog
