HOT TOPICS LIST
- MACD
- Fibonacci
- RSI
- Gann
- ADXR
- Stochastics
- Volume
- Triangles
- Futures
- Cycles
- Volatility
- ZIGZAG
- MESA
- Retracement
- Aroon
INDICATORS LIST
LIST OF TOPICS
PRINT THIS ARTICLE
by Kevin Hopson
Though pessimism is growing in the marketplace, the S&P 500 could see further weakness before putting in a temporary bottom.
Position: N/A
Kevin Hopson
Kevin has been a technical analyst for roughly 10 years now. Previously, Kevin owned his own business and acted as a registered investment advisor, specializing in energy. He was also a freelance oil analyst for Orient Trading Co., a commodity futures trading firm in Japan. Kevin is currently a freelance writer.
PRINT THIS ARTICLE
VOLATILITY
What The VIX Could Be Telling Us
05/11/04 11:50:24 AMby Kevin Hopson
Though pessimism is growing in the marketplace, the S&P 500 could see further weakness before putting in a temporary bottom.
Position: N/A
| The Chicago Board Options Exchange's Market Volatility Index (VIX), which measures expected market volatility via options activity in the S&P 500 Index, is one of the primary tools used by contrarian investors because the VIX tends to be a good fear indicator. When investors are flocking to put options rather than call options, the VIX will rise in price. A rise in the VIX means that investors are becoming more pessimistic in the marketplace. Since extreme pessimism often occurs at market bottoms, contrarian investors look for a spike in volatility as a sign of a forthcoming bottom, and vice-versa (lack of volatility or complacency as a sign of a forthcoming top). |
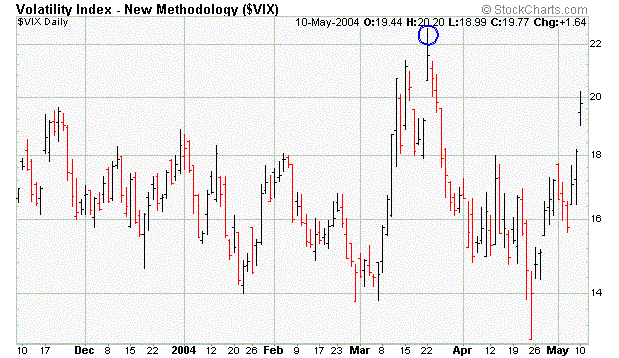
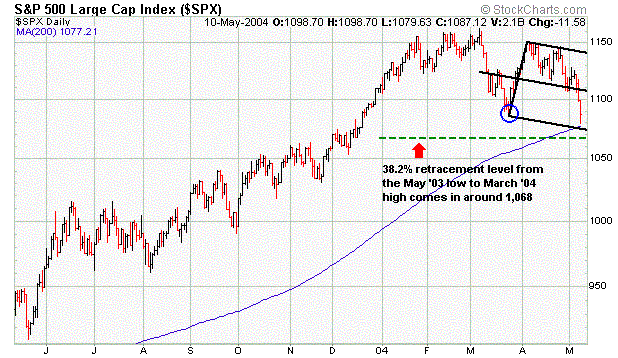
 Figure 1: The VIX. Since early April, the S&P 500 Index (SPX) has been in a steady decline, with selling pressure picking up in recent days. During this time, the VIX has moved higher, as would be expected. However, there are divergences between the SPX and VIX that could indicate further selling pressure in the S&P 500 before bottoming out. Looking at the one-year chart for the SPX, you will notice that the index took out March's low on May 10. On the other hand, the VIX - which tends to move opposite of the SPX - has failed to breach (or even test) the March high. The March low in the SPX and the March high in the VIX have both been circled in blue on their respective charts. |

|
| Figure 2: The $SPX. |
| Graphic provided by: Stockcharts.com. |
| |
| This means that market sentiment - though becoming more pessimistic - has not exceeded the levels seen in late March. Since the SPX has hit new lows in 2004 and the VIX has failed to hit new highs, investors are showing less fear (or more complacency) than they were a month-and-a-half ago. As a result, there could be a further rise in the VIX (at least of test of March's high or a double top) before the SPX puts in a short-term bottom. If and when this occurs, a possible bottoming point is the 1,068 to 1,077 range. Not only is this the site of the index's 200-day moving average, but it is also the site of the 38.2 percent retracement level from the May '03 to March '04 rally. Furthermore, the bottom parallel line of the modified pitchfork is converging here. |
Kevin has been a technical analyst for roughly 10 years now. Previously, Kevin owned his own business and acted as a registered investment advisor, specializing in energy. He was also a freelance oil analyst for Orient Trading Co., a commodity futures trading firm in Japan. Kevin is currently a freelance writer.
| Glen Allen, VA | |
| E-mail address: | hopson_1@yahoo.com |
Click here for more information about our publications!
Comments
Date: 05/11/04Rank: 4Comment:
Date: 05/12/04Rank: 5Comment:
Date: 06/02/04Rank: 4Comment:

Request Information From Our Sponsors
- StockCharts.com, Inc.
- Candle Patterns
- Candlestick Charting Explained
- Intermarket Technical Analysis
- John Murphy on Chart Analysis
- John Murphy's Chart Pattern Recognition
- John Murphy's Market Message
- MurphyExplainsMarketAnalysis-Intermarket Analysis
- MurphyExplainsMarketAnalysis-Visual Analysis
- StockCharts.com
- Technical Analysis of the Financial Markets
- The Visual Investor
- VectorVest, Inc.
- Executive Premier Workshop
- One-Day Options Course
- OptionsPro
- Retirement Income Workshop
- Sure-Fire Trading Systems (VectorVest, Inc.)
- Trading as a Business Workshop
- VectorVest 7 EOD
- VectorVest 7 RealTime/IntraDay
- VectorVest AutoTester
- VectorVest Educational Services
- VectorVest OnLine
- VectorVest Options Analyzer
- VectorVest ProGraphics v6.0
- VectorVest ProTrader 7
- VectorVest RealTime Derby Tool
- VectorVest Simulator
- VectorVest Variator
- VectorVest Watchdog
