

HOT TOPICS LIST
- MACD
- Fibonacci
- RSI
- Gann
- ADXR
- Stochastics
- Volume
- Triangles
- Futures
- Cycles
- Volatility
- ZIGZAG
- MESA
- Retracement
- Aroon
INDICATORS LIST
LIST OF TOPICS
PRINT THIS ARTICLE
by Steven Coffey
With price slightly above breakout point, this trade presents an excellent risk/reward ratio.
Position: Buy
Steven Coffey
Steven Coffey is an independent stock trader with a background in Information Systems development and training. He resides in the Boston area.
PRINT THIS ARTICLE
BREAKOUTS
Nextel Partners Inc. Just Broke New Two Year High
05/11/04 12:04:58 PMby Steven Coffey
With price slightly above breakout point, this trade presents an excellent risk/reward ratio.
Position: Buy
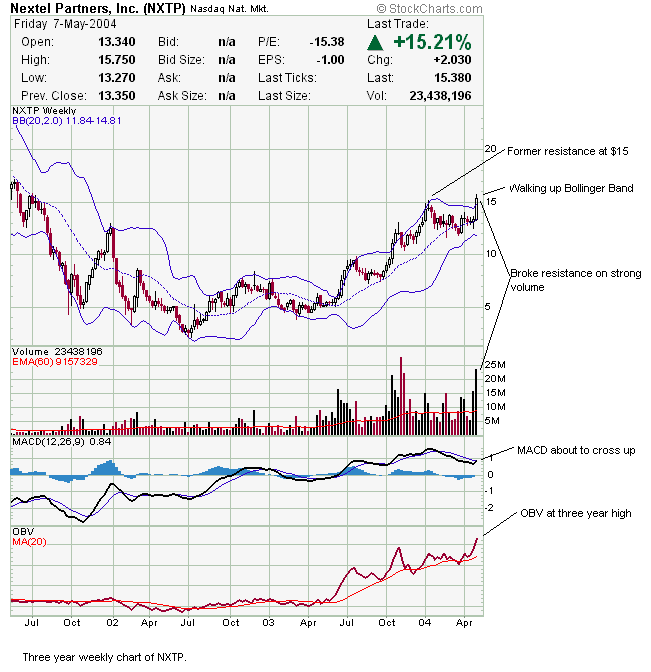
| On May 7, Nextel Partners Inc. (NXTP) broke above its most recent high of $15, set in January. Looking at the three year weekly chart, you can see that after reaching this January high, it came down somewhat. However, in the last six weeks, the volume has picked up substantially and has propelled this stock above that $15 high. In a breakout formation such as this, stocks tend to rise, with the breakout point serving as support. |
| As far as a price target is concerned, in the past this stock has generally gained about $5 from the bottom of each minor rally. The current rally began seven weeks ago at about the $12 mark, which would indicate that NXTP should make a short-term rally to approximately $17. Based on Friday's close, this would provide a potential reward of $1.62/share ($17 target minus $15.38 closing price) against a potential loss of $.38/share (closing price minus a stop-loss at the $15 support level), or a risk/reward ratio of 23%, which is favorable. In the longer term, I believe NXTP can go higher than that. |
|
| Figure 1: Weekly chart for NXTP. |
| Graphic provided by: StockCharts.com. |
| |
| Some favorable indicators also merit discussion, one of which is the Bollinger Bands. This indicator depicts price volatility. When the bands narrow, as they have in the past several weeks, it indicates that the stock price can begin to change drastically. The signal for this is when the price closes outside one of the bands, as NXTP did on Friday. The stock will then generally move in the direction of the breakout, in this case, up. Another positive indicator on this chart is the MACD. You can see that it's coming up and is about to cross above the signal line, which would be a bullish indication that the stock is going to continue to rise. Finally, the OBV (on balance volume) indicator has reached its highest point on this three year chart. This shows that the stock is being accumulated. As long as there are more buyers than sellers, this stock should continue to go up. |
| With this new breakout above $15, NXTP is providing a good opportunity to buy on strength and yet still minimize risk. If you buy and it goes below $15, that would be a failed signal, and would therefore be time to get out. However, if it goes to $17, you could net a quick 10% gain. And as I mentioned earlier, I think that in the longer term, it can go higher than $17. |
Steven Coffey is an independent stock trader with a background in Information Systems development and training. He resides in the Boston area.
| E-mail address: | stevencoffey@yahoo.com |
Click here for more information about our publications!
PRINT THIS ARTICLE

Request Information From Our Sponsors
- StockCharts.com, Inc.
- Candle Patterns
- Candlestick Charting Explained
- Intermarket Technical Analysis
- John Murphy on Chart Analysis
- John Murphy's Chart Pattern Recognition
- John Murphy's Market Message
- MurphyExplainsMarketAnalysis-Intermarket Analysis
- MurphyExplainsMarketAnalysis-Visual Analysis
- StockCharts.com
- Technical Analysis of the Financial Markets
- The Visual Investor
- VectorVest, Inc.
- Executive Premier Workshop
- One-Day Options Course
- OptionsPro
- Retirement Income Workshop
- Sure-Fire Trading Systems (VectorVest, Inc.)
- Trading as a Business Workshop
- VectorVest 7 EOD
- VectorVest 7 RealTime/IntraDay
- VectorVest AutoTester
- VectorVest Educational Services
- VectorVest OnLine
- VectorVest Options Analyzer
- VectorVest ProGraphics v6.0
- VectorVest ProTrader 7
- VectorVest RealTime Derby Tool
- VectorVest Simulator
- VectorVest Variator
- VectorVest Watchdog