HOT TOPICS LIST
- MACD
- Fibonacci
- RSI
- Gann
- ADXR
- Stochastics
- Volume
- Triangles
- Futures
- Cycles
- Volatility
- ZIGZAG
- MESA
- Retracement
- Aroon
INDICATORS LIST
LIST OF TOPICS
PRINT THIS ARTICLE
by Han Kim
How do you tell the difference between a correction and a reversal at the top before it's too late? Being able to recognize the double top pattern could be to your advantage.
Position: N/A
Han Kim
Traders.com Advantage Staff Writer
PRINT THIS ARTICLE
DOUBLE TOPS
Recognizing The Double Top Reversal Pattern
05/11/00 10:49:50 AMby Han Kim
How do you tell the difference between a correction and a reversal at the top before it's too late? Being able to recognize the double top pattern could be to your advantage.
Position: N/A
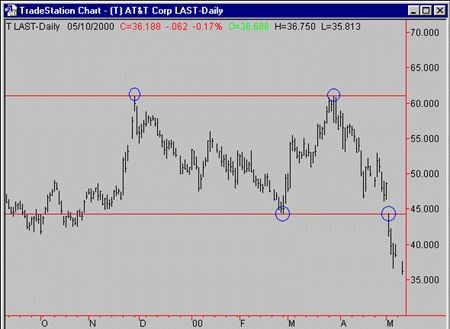
| The double top is a classic reversal pattern that recognizes a turnaround from bullish (uptrend) to bearish (downtrend) price movement. The following graph of AT&T (T) has the four points of a classic double top reversal pattern highlighted with circles. |

|
| The double top reversal pattern for AT&T (T). |
| Graphic provided by: TradeStation. |
| |
| Double top formations are based on the concept of supply and demand. When a security is in an upternd, there are more buyers than sellers and the price rises. At some point the price rise enough that demand will lessen and the security's price will top out. In a double top reversal pattern, as shown in the A&T chart, this will become a major resistance point. Trading volume characteristically increases dramatically as the stock tops out. From here the market begins to retreat, usually due to profit taking, until it reaches a low, where supply begins to catch up with demand, and the stock rises again. The stock is now in a corrective phase. |
| Following the corrective phase is another rally to test whether the price will go through that previously set resistance, completing the valley. The low point of the valley forms a support line. When the price reaches the previously set resistance and fails to go beyond, it creates another peak. This second peak indicates either a double top or another corrective phase. Frequently, the volume at the second peak is also noticeably larger, but usually less, than the volume at the first peak. When the price falls below the support, it completes the double top. At this point, it is a reversal. |
Traders.com Advantage Staff Writer
| Title: | Webmaster |
| Company: | Technical Analysis, Inc. |
| Address: | 4757 California AVE SW |
| Seattle, WA 98116 | |
| Phone # for sales: | 206-938-0570 |
| Fax: | 206-938-1307 |
| Website: | www.traders.com |
| E-mail address: | hkim@traders.com |
Traders' Resource Links | |
| Charting the Stock Market: The Wyckoff Method -- Books | |
| Working-Money.com -- Online Trading Services | |
| Traders.com Advantage -- Online Trading Services | |
| Technical Analysis of Stocks & Commodities -- Publications and Newsletters | |
| Working Money, at Working-Money.com -- Publications and Newsletters | |
| Traders.com Advantage -- Publications and Newsletters | |
| Professional Traders Starter Kit -- Software | |
Click here for more information about our publications!
Comments
Date: / /Rank: 4Comment:

Request Information From Our Sponsors
- StockCharts.com, Inc.
- Candle Patterns
- Candlestick Charting Explained
- Intermarket Technical Analysis
- John Murphy on Chart Analysis
- John Murphy's Chart Pattern Recognition
- John Murphy's Market Message
- MurphyExplainsMarketAnalysis-Intermarket Analysis
- MurphyExplainsMarketAnalysis-Visual Analysis
- StockCharts.com
- Technical Analysis of the Financial Markets
- The Visual Investor
- VectorVest, Inc.
- Executive Premier Workshop
- One-Day Options Course
- OptionsPro
- Retirement Income Workshop
- Sure-Fire Trading Systems (VectorVest, Inc.)
- Trading as a Business Workshop
- VectorVest 7 EOD
- VectorVest 7 RealTime/IntraDay
- VectorVest AutoTester
- VectorVest Educational Services
- VectorVest OnLine
- VectorVest Options Analyzer
- VectorVest ProGraphics v6.0
- VectorVest ProTrader 7
- VectorVest RealTime Derby Tool
- VectorVest Simulator
- VectorVest Variator
- VectorVest Watchdog
