HOT TOPICS LIST
- MACD
- Fibonacci
- RSI
- Gann
- ADXR
- Stochastics
- Volume
- Triangles
- Futures
- Cycles
- Volatility
- ZIGZAG
- MESA
- Retracement
- Aroon
INDICATORS LIST
LIST OF TOPICS
PRINT THIS ARTICLE
by Gary Grosschadl
The price of gold violates a major pattern. Unless it bounces immediately, more downside is in store.
Position: Sell
Gary Grosschadl
Independent Canadian equities trader and technical analyst based in Peterborough
Ontario, Canada.
PRINT THIS ARTICLE
DOUBLE TOPS
Weekly Chart For Gold Shows Danger
05/12/04 11:38:43 AMby Gary Grosschadl
The price of gold violates a major pattern. Unless it bounces immediately, more downside is in store.
Position: Sell
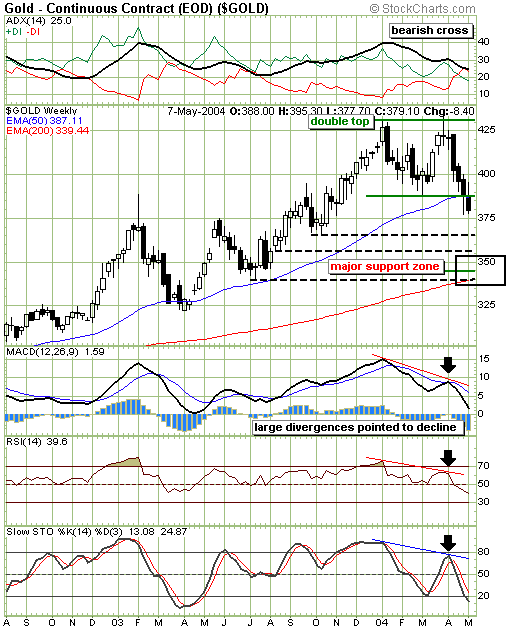
| Traders who spotted the divergences on the displayed indicators did well to sell their gold stocks as the suspected double top did prevail. Now as the troughline has been broken to the downside (also note the 50-period EMA has been violated), traders are pondering whether the double top will fulfill to the measured downside mark, that being the $340 area. A double top is confirmed when the troughline is broken and this is the case here. The measured move is the distance from the troughline to the double top, as applied to the downside break below the troughline. |
| Three other possible supports have been drawn into the chart using dotted lines. The two higher possible supports are found at previous support/resistance areas at $365 and in the area of $355 as indicated. Below that is an area of major support between $355 and $339. This includes the psychological $350 mark, the double top fullfilment target at $345 and the 200-period EMA at $339. |

|
| Gold's weekly chart shows reasons for concern. |
| Graphic provided by: Stockcharts.com. |
| |
| Traders should watch for any major reversal patterns occurring at or near those points. This will likely coincide with a stochastic reversal below 20 to rise above that 20 level. At the same time, the RSI (relative strength index) should confirm some bullish follow through by rising above its often crucial 50 level. |
Independent Canadian equities trader and technical analyst based in Peterborough
Ontario, Canada.
| Website: | www.whatsonsale.ca/financial.html |
| E-mail address: | gwg7@sympatico.ca |
Click here for more information about our publications!
Comments
Date: 05/12/04Rank: 5Comment:
Date: 05/17/04Rank: 5Comment:
Date: 05/18/04Rank: 5Comment:

Request Information From Our Sponsors
- StockCharts.com, Inc.
- Candle Patterns
- Candlestick Charting Explained
- Intermarket Technical Analysis
- John Murphy on Chart Analysis
- John Murphy's Chart Pattern Recognition
- John Murphy's Market Message
- MurphyExplainsMarketAnalysis-Intermarket Analysis
- MurphyExplainsMarketAnalysis-Visual Analysis
- StockCharts.com
- Technical Analysis of the Financial Markets
- The Visual Investor
- VectorVest, Inc.
- Executive Premier Workshop
- One-Day Options Course
- OptionsPro
- Retirement Income Workshop
- Sure-Fire Trading Systems (VectorVest, Inc.)
- Trading as a Business Workshop
- VectorVest 7 EOD
- VectorVest 7 RealTime/IntraDay
- VectorVest AutoTester
- VectorVest Educational Services
- VectorVest OnLine
- VectorVest Options Analyzer
- VectorVest ProGraphics v6.0
- VectorVest ProTrader 7
- VectorVest RealTime Derby Tool
- VectorVest Simulator
- VectorVest Variator
- VectorVest Watchdog
