HOT TOPICS LIST
- MACD
- Fibonacci
- RSI
- Gann
- ADXR
- Stochastics
- Volume
- Triangles
- Futures
- Cycles
- Volatility
- ZIGZAG
- MESA
- Retracement
- Aroon
INDICATORS LIST
LIST OF TOPICS
PRINT THIS ARTICLE
by Ashwani Gujral
Crude oil has broken out of consolidation patterns both on the weekly and daily charts. Breakouts on two time frames simultaneously lead to powerful moves. One thing is sure: Crude oil has broken out of a strong base for this rally and it is unlikely to enter a downtrend in a hurry.
Position: N/A
Ashwani Gujral
He is founder of AGIP Securities Pvt. Ltd. which offers money management services, live chat rooms (during market hours) and independent technical analysis consultancy. The company has a big media presence from the likes of CNBC, NDTV Profit, and ZEE Business.
PRINT THIS ARTICLE
CONSOLID FORMATION
Crude Oil Futures Break Out
05/12/04 11:27:39 AMby Ashwani Gujral
Crude oil has broken out of consolidation patterns both on the weekly and daily charts. Breakouts on two time frames simultaneously lead to powerful moves. One thing is sure: Crude oil has broken out of a strong base for this rally and it is unlikely to enter a downtrend in a hurry.
Position: N/A
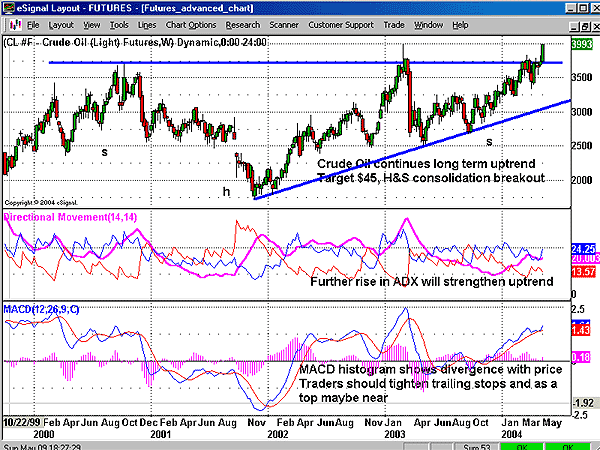
| As a stock goes through its daily price gyrations, on a larger, weekly time frame its chart can often stay in a consolidation pattern for years. But when these weekly consolidations break out to the upside, they ought to be taken very seriously as they herald a new long-term bull move. I believe that Crude oil futures have broken out of a weekly head and shoulders pattern and could easily head into the mid-forties. (For some background, read my article "Crude Oil Moves Up Slowly But Surely," Traders.com Advantage, 3/26/04.) This consolidation has occured after an uptrend and in this situation you can expect an upside breakout three times out of four. But you should wait and take a long position only after it has broken out of the top of the consolidation. This could easily have been a distribution pattern ending up in a downside break. The only way of judging which way it will go is by doing an analysis across time frames and watching for volume confirmations. Trying to preempt any breakout can spell disaster. |

|
| Figure 1: Weekly chart of oil futures. |
| Graphic provided by: eSignal. |
| |
| On the weekly chart of crude oil futures there is a breakout from a head and shoulders consolidation formation. This formation has taken about four years to complete and therefore is extremely significant in technical analysis terms. The target of this breakout can be calculated by assuming that it occured in the middle of an upmove, so the length of the move before this consolidation pattern is likely to be the length after a breakout from this consolidation. This yields a target of $45 for crude oil. A move higher by the ADX will indicate a strengthening of the trend. As the ADX lags price, this might be expected shortly. The MACD is already in buy mode. The histogram, however, has failed to make a new high with the new price. This divergence will take some time to develop and as it widens, crude oil will be heading towards an intermediate top. More evidence, particularly from the price, will be required. However stops can be tightened slowly. |
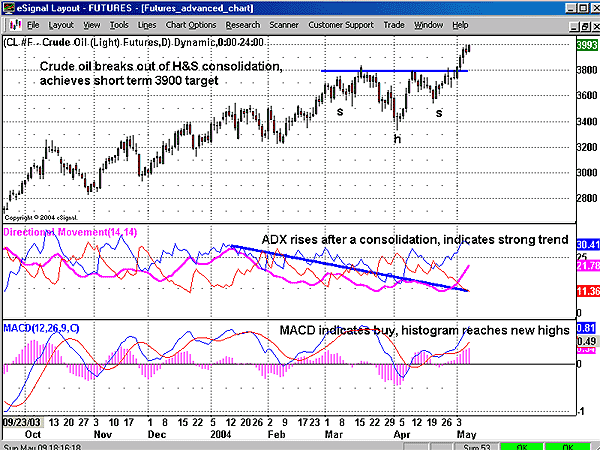
 Figure 2: Daily chart of crude oil futures. On the daily chart, crude oil futures have broken out of a smaller consolidation pattern. The breakout had a target of $39 which has already been achieved. This target was suggested in my previous article. The ADX has risen sharply after a long consolidation, indicating a fresh trend that is gaining strength. This uptrend is confirmed by the weekly time frame as well. The MACD is in buy mode and the daily histogram is making new highs, indicating more upmove in store. |
| The strength of the upmove is indicated by confirmation across time frames. Breakouts from a consolidation pattern formed over a longer period of time should be taken more seriously. This consolidation is likely to provide support to the crude oil price over a period of time. In other words, oil price may not come down in a hurry. |
He is founder of AGIP Securities Pvt. Ltd. which offers money management services, live chat rooms (during market hours) and independent technical analysis consultancy. The company has a big media presence from the likes of CNBC, NDTV Profit, and ZEE Business.
| Title: | Chief mkt strategist |
| Company: | AGIP Securities |
| India | |
| Phone # for sales: | 9871066337 |
| Website: | www.ashwanigujral.com |
| E-mail address: | contact@ashwanigujral.com |
Traders' Resource Links | |
| AGIP Securities has not added any product or service information to TRADERS' RESOURCE. | |
Click here for more information about our publications!
Comments
Date: 05/12/04Rank: 5Comment:
Date: 05/17/04Rank: 5Comment:
Date: 05/18/04Rank: 5Comment:

Request Information From Our Sponsors
- StockCharts.com, Inc.
- Candle Patterns
- Candlestick Charting Explained
- Intermarket Technical Analysis
- John Murphy on Chart Analysis
- John Murphy's Chart Pattern Recognition
- John Murphy's Market Message
- MurphyExplainsMarketAnalysis-Intermarket Analysis
- MurphyExplainsMarketAnalysis-Visual Analysis
- StockCharts.com
- Technical Analysis of the Financial Markets
- The Visual Investor
- VectorVest, Inc.
- Executive Premier Workshop
- One-Day Options Course
- OptionsPro
- Retirement Income Workshop
- Sure-Fire Trading Systems (VectorVest, Inc.)
- Trading as a Business Workshop
- VectorVest 7 EOD
- VectorVest 7 RealTime/IntraDay
- VectorVest AutoTester
- VectorVest Educational Services
- VectorVest OnLine
- VectorVest Options Analyzer
- VectorVest ProGraphics v6.0
- VectorVest ProTrader 7
- VectorVest RealTime Derby Tool
- VectorVest Simulator
- VectorVest Variator
- VectorVest Watchdog
