HOT TOPICS LIST
- MACD
- Fibonacci
- RSI
- Gann
- ADXR
- Stochastics
- Volume
- Triangles
- Futures
- Cycles
- Volatility
- ZIGZAG
- MESA
- Retracement
- Aroon
INDICATORS LIST
LIST OF TOPICS
PRINT THIS ARTICLE
by Ashwani Gujral
Amgen (AMGN) has formed a bearish descending triangle pattern on the weekly chart, very similar to the Nasdaq composite, while the daily chart seems to be consolidating. When two time frames support each other, the signal is confirmed.
Position: N/A
Ashwani Gujral
He is founder of AGIP Securities Pvt. Ltd. which offers money management services, live chat rooms (during market hours) and independent technical analysis consultancy. The company has a big media presence from the likes of CNBC, NDTV Profit, and ZEE Business.
PRINT THIS ARTICLE
DESCENDING TRIANGLES
Amgen Breakdown Likely
05/11/04 09:11:48 AMby Ashwani Gujral
Amgen (AMGN) has formed a bearish descending triangle pattern on the weekly chart, very similar to the Nasdaq composite, while the daily chart seems to be consolidating. When two time frames support each other, the signal is confirmed.
Position: N/A
| Descending triangles are topping out patterns that form during an uptrend. In it, the bulls fail to take a high out and form a lower high, then they break through the previous low. This trading pattern starts when the weak hands see a lower top and they liquidate their longs, thus price comes under increasing pressure and a sequence of lower tops and bottoms form. This is the start of a downtrend. |
| When a descending triangle is forming, keep an eye on the volume when the breakdown occurs, as well as the higher time frame. Sometimes a low volume breakdown or a bullish pattern on a higher time frame can lead to pattern failure, trapping the bears. In such cases, prices fail to achieve conventional targets. The descending triangle pattern is one of the easiest to trade since it provides a clue to both the direction and target of the expected move. |

|
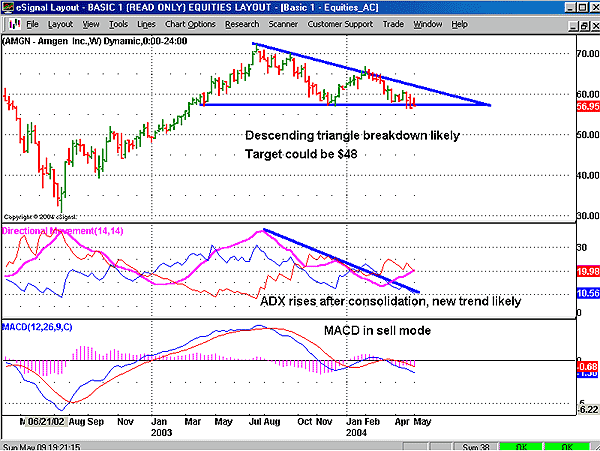
| Figure 1: Weekly chart of Amgen. |
| Graphic provided by: eSignal. |
| |
| On the weekly chart, there is an imminent breakdown of a descending triangle formation. The target for this formation should be the measured width of the first reaction subtracted from the level of the horizontal breakdown line. This leads to a target of $48. The lower top can be used as a stop-loss in case the downside breakdown does not materialize. The ADX, which had been consolidating all this time, has now started rising to a level of about 19, indicating a trending move. Another piece of evidence confirming this bearish view is that the Nasdaq composite has a similar bearish pattern and a breakdown here will lead to a breakdown of all stocks with similar topping out patterns. |
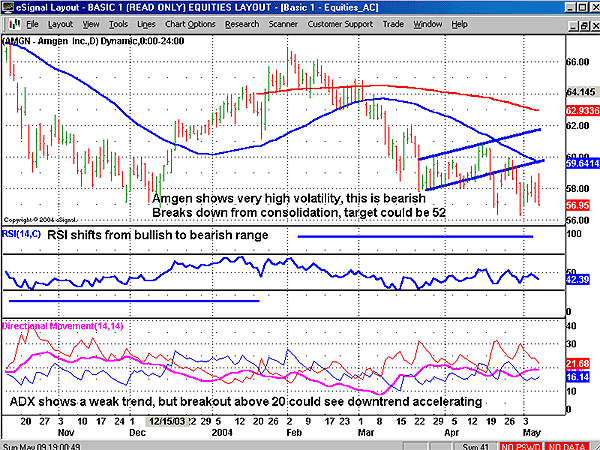
 Figure 2: Daily chart of Amgen. On the daily chart, Amgen seems to have been in a downtrend for some time. It consolidated for a while in the $58-62 area before breaking down. The stock is showing high volatility, which is always bearish. A breakdown below $56 would lead to a fresh downmove where the daily target could be $52. The RSI has shifted its range from bullish to bearish as it begins to find resistance around the 50 level. The ADX shows a weak trend right now but is likely to strengthen under the $56 level. |
| Technical patterns are best used when there are a lot of factors in confluence. In the above case, both daily and weekly charts confirm bearish patterns. Also the Nasdaq composite shows the same pattern and therefore increases the chances of a bearish breakdown. |
He is founder of AGIP Securities Pvt. Ltd. which offers money management services, live chat rooms (during market hours) and independent technical analysis consultancy. The company has a big media presence from the likes of CNBC, NDTV Profit, and ZEE Business.
| Title: | Chief mkt strategist |
| Company: | AGIP Securities |
| India | |
| Phone # for sales: | 9871066337 |
| Website: | www.ashwanigujral.com |
| E-mail address: | contact@ashwanigujral.com |
Traders' Resource Links | |
| AGIP Securities has not added any product or service information to TRADERS' RESOURCE. | |
Click here for more information about our publications!
PRINT THIS ARTICLE

|

Request Information From Our Sponsors
- StockCharts.com, Inc.
- Candle Patterns
- Candlestick Charting Explained
- Intermarket Technical Analysis
- John Murphy on Chart Analysis
- John Murphy's Chart Pattern Recognition
- John Murphy's Market Message
- MurphyExplainsMarketAnalysis-Intermarket Analysis
- MurphyExplainsMarketAnalysis-Visual Analysis
- StockCharts.com
- Technical Analysis of the Financial Markets
- The Visual Investor
- VectorVest, Inc.
- Executive Premier Workshop
- One-Day Options Course
- OptionsPro
- Retirement Income Workshop
- Sure-Fire Trading Systems (VectorVest, Inc.)
- Trading as a Business Workshop
- VectorVest 7 EOD
- VectorVest 7 RealTime/IntraDay
- VectorVest AutoTester
- VectorVest Educational Services
- VectorVest OnLine
- VectorVest Options Analyzer
- VectorVest ProGraphics v6.0
- VectorVest ProTrader 7
- VectorVest RealTime Derby Tool
- VectorVest Simulator
- VectorVest Variator
- VectorVest Watchdog
