

HOT TOPICS LIST
- MACD
- Fibonacci
- RSI
- Gann
- ADXR
- Stochastics
- Volume
- Triangles
- Futures
- Cycles
- Volatility
- ZIGZAG
- MESA
- Retracement
- Aroon
INDICATORS LIST
LIST OF TOPICS
PRINT THIS ARTICLE
by Luis Ferro
After a prolonged uptrend the Dow Jones Steel Index formed a double top pattern. A trend reversal seems to be the most likely outcome, but how do you take advantage of this situation? By looking through the Index Components and choosing the one displaying the weakest behavior.
Position: Sell
Luis Ferro
Trader and technical analyst living in Bern, Switzerland. A full member of the STA, currently enrolled in the DITA program and the CMT program.
PRINT THIS ARTICLE
DOUBLE TOPS
Weakness In Steel Index Suggests Shorting Opportunities
05/11/04 09:09:11 AMby Luis Ferro
After a prolonged uptrend the Dow Jones Steel Index formed a double top pattern. A trend reversal seems to be the most likely outcome, but how do you take advantage of this situation? By looking through the Index Components and choosing the one displaying the weakest behavior.
Position: Sell
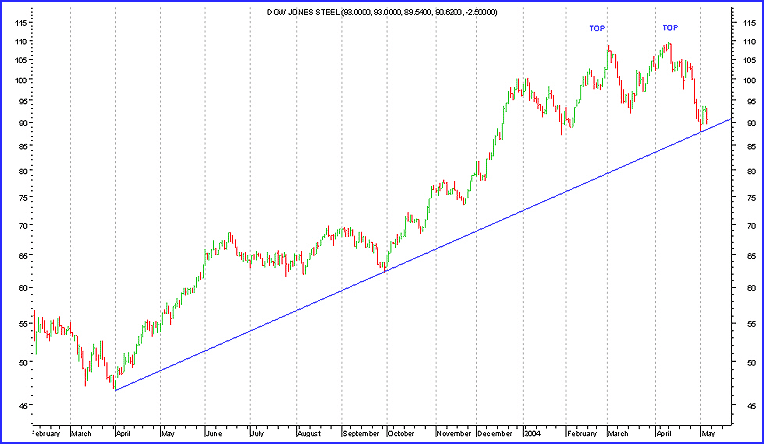 Figure 1: Chart of the Dow Jones Steel Index. The first sign of weakness showed up on the Steel Index when the peak in April failed to significanly surpass the previous March top. After that, prices started to go down, falling below the previous trough at the 93.2 level. Consequently a double top formed. The Index fell a little more, touching the upper trendline, and then returned to the breakout level of the double top at 93.2. This type of hesitation, in which a pullback to the breakout level occurs, is very common among all chart patterns and should never be interpreted as a pattern failure. Up until now the double top must still be regarded as valid and the forecast still points to a correction. |
| Although this is an interesting situation, it is not possible to use this to trade the Steel Index. In order to profit from the probable correction of the Index, it is necessary to scan the Index Components and select a stock that also shows good probabilities of a correction in price. |
|
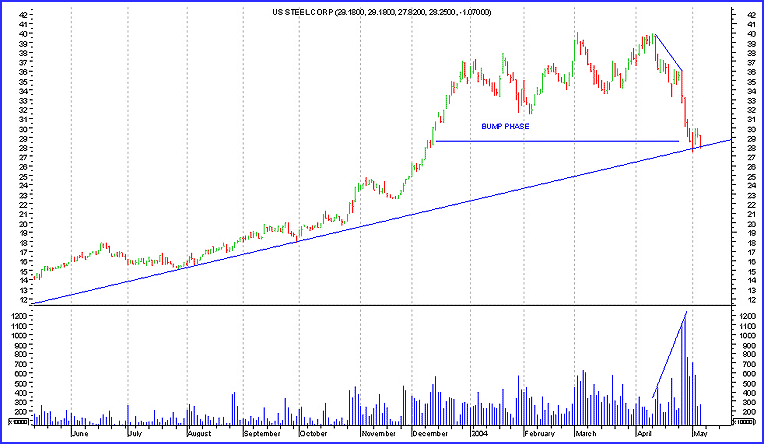
| Figure 2: Chart of U.S. Steel Corporation. |
| Graphic provided by: MetaStock. |
| |
| United States Steel (X) seems to be a good candidate for short selling. The daily chart of the stock shows the formation of a reversal pattern called "bump-and-run," first described in the book Encyclopedia of Chart Patterns by Tom Bulkowski. When this formation occurs prices initially rise close to the trendline then, in the bump phase, climb away from the trendline. After the bump phase prices crash down, cross the trendline, and continue to fall. |
| Until now prices have not crossed the trendline, but volume has been increasing when prices fall and decreasing when prices rise, therefore suggesting that the bump-and-run pattern will indeed be completed, and consequently prices will continue to fall. |
Trader and technical analyst living in Bern, Switzerland. A full member of the STA, currently enrolled in the DITA program and the CMT program.
| Address: | Switzerland |
| E-mail address: | luispgsf@yahoo.com |
Click here for more information about our publications!
Comments
Date:�05/11/04Rank:�5Comment:�

Request Information From Our Sponsors
- StockCharts.com, Inc.
- Candle Patterns
- Candlestick Charting Explained
- Intermarket Technical Analysis
- John Murphy on Chart Analysis
- John Murphy's Chart Pattern Recognition
- John Murphy's Market Message
- MurphyExplainsMarketAnalysis-Intermarket Analysis
- MurphyExplainsMarketAnalysis-Visual Analysis
- StockCharts.com
- Technical Analysis of the Financial Markets
- The Visual Investor
- VectorVest, Inc.
- Executive Premier Workshop
- One-Day Options Course
- OptionsPro
- Retirement Income Workshop
- Sure-Fire Trading Systems (VectorVest, Inc.)
- Trading as a Business Workshop
- VectorVest 7 EOD
- VectorVest 7 RealTime/IntraDay
- VectorVest AutoTester
- VectorVest Educational Services
- VectorVest OnLine
- VectorVest Options Analyzer
- VectorVest ProGraphics v6.0
- VectorVest ProTrader 7
- VectorVest RealTime Derby Tool
- VectorVest Simulator
- VectorVest Variator
- VectorVest Watchdog