HOT TOPICS LIST
- MACD
- Fibonacci
- RSI
- Gann
- ADXR
- Stochastics
- Volume
- Triangles
- Futures
- Cycles
- Volatility
- ZIGZAG
- MESA
- Retracement
- Aroon
INDICATORS LIST
LIST OF TOPICS
PRINT THIS ARTICLE
by Gary Grosschadl
Alcoa, the dominant aluminum giant, has a heavy chart.
Position: Sell
Gary Grosschadl
Independent Canadian equities trader and technical analyst based in Peterborough
Ontario, Canada.
PRINT THIS ARTICLE
CHART ANALYSIS
Alcoa Inc. In Trouble
05/07/04 09:23:42 AMby Gary Grosschadl
Alcoa, the dominant aluminum giant, has a heavy chart.
Position: Sell
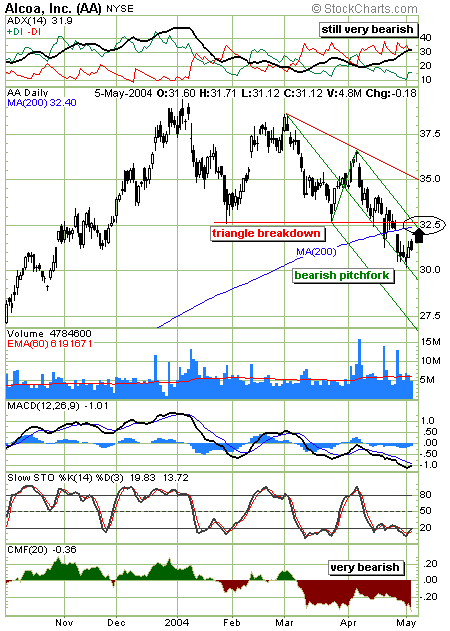
| Since peaking at $39.44, Alcoa has hit two successive lower peaks, forming a descending triangle with support at the $32.50 level. Recently this support gave way via this triangle breakdown. In light of this bearish dip, a closer look reveals additional negative influences. |
| Initially the stock found temporary support from its 200-day moving average but this too gave way adding more fuel to the bearish outlook. Stocks that fall below this crucial moving average often have this turn into formidable upside resistance as former support becomes future resistance. |

|
| Alcoa's daily chart gives several reasons for concern. |
| Graphic provided by: stockcharts.com. |
| |
| Adding an Andrews pitchfork shows yet another reason for concern. Using the last prominent pivot points, a clear downward path has been established by this pitchfork method. The trend remains down until the upper median line is broken. What has been established is very likely a powerful confluence of resistance from the triangle's lower trendline, the 200-day MA, and the pitchfork's upper limit. Traders recognizing this may be targeting a shorting opportunity as Alcoa attempts to test this confluence of resistance. Downside targets would be the median line area of $30 followed by the lower median line at approximately $27. |
| The displayed indicator graphs are also showing their own negativity. A surprise upside move above $32.50 would negate the bearish tone of this analysis but for now the outlook is decidedly a heavy burden for this leader of light metals. |
Independent Canadian equities trader and technical analyst based in Peterborough
Ontario, Canada.
| Website: | www.whatsonsale.ca/financial.html |
| E-mail address: | gwg7@sympatico.ca |
Click here for more information about our publications!
PRINT THIS ARTICLE

Request Information From Our Sponsors
- StockCharts.com, Inc.
- Candle Patterns
- Candlestick Charting Explained
- Intermarket Technical Analysis
- John Murphy on Chart Analysis
- John Murphy's Chart Pattern Recognition
- John Murphy's Market Message
- MurphyExplainsMarketAnalysis-Intermarket Analysis
- MurphyExplainsMarketAnalysis-Visual Analysis
- StockCharts.com
- Technical Analysis of the Financial Markets
- The Visual Investor
- VectorVest, Inc.
- Executive Premier Workshop
- One-Day Options Course
- OptionsPro
- Retirement Income Workshop
- Sure-Fire Trading Systems (VectorVest, Inc.)
- Trading as a Business Workshop
- VectorVest 7 EOD
- VectorVest 7 RealTime/IntraDay
- VectorVest AutoTester
- VectorVest Educational Services
- VectorVest OnLine
- VectorVest Options Analyzer
- VectorVest ProGraphics v6.0
- VectorVest ProTrader 7
- VectorVest RealTime Derby Tool
- VectorVest Simulator
- VectorVest Variator
- VectorVest Watchdog
