HOT TOPICS LIST
- MACD
- Fibonacci
- RSI
- Gann
- ADXR
- Stochastics
- Volume
- Triangles
- Futures
- Cycles
- Volatility
- ZIGZAG
- MESA
- Retracement
- Aroon
INDICATORS LIST
LIST OF TOPICS
PRINT THIS ARTICLE
by Gary Grosschadl
A dramatic fall the past several weeks has cut the stock price in half and bargain hunting buyers could be stepping in.
Position: Buy
Gary Grosschadl
Independent Canadian equities trader and technical analyst based in Peterborough
Ontario, Canada.
PRINT THIS ARTICLE
CHART ANALYSIS
Sierra Wireless Inc. (SW.TO) Tries To Bounce
05/07/04 09:57:07 AMby Gary Grosschadl
A dramatic fall the past several weeks has cut the stock price in half and bargain hunting buyers could be stepping in.
Position: Buy
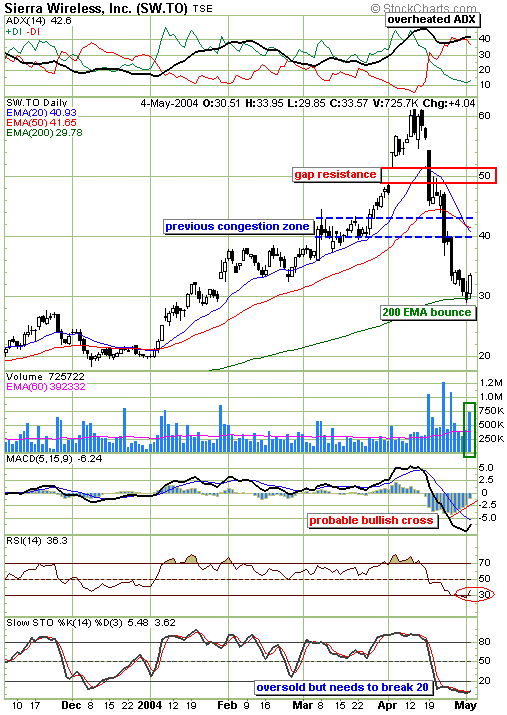
| Profit takers and traders have punished this stock severely recently and this may have been overdone. If so bargain hunters may be taking a closer look. The stock has come all the way down to its 200-day EMA and this point often serves as strong support on many charts. This $30 area also represents an area of previous congestion from last January. A volume spike shows some buyers are interested. |
| Several indicators are worth considering. The ADX component (from the directional movement indicator at the top graph) is at an overheated level being above 40 and both DIs. This often leads to a bounce as momentum can shift away from the bears to the bulls. If so watch for the DIs to converge as bullish power (+DI) strengthens and bearish power (-DI) wanes. The lower three indicators all show an oversold condition which can set up bounce or upleg possibilities. The shorter term MACD setting (moving average convergence/divergence) hints at a turn in the making. The upsloping histogram infers that a bullish crossing of the MACD(over its signal line)will occur. While the stochastic indicator is also hinting at a turn developing, most traders like to see a move above the 20 level to gain confidence in a sustainable or at least a tradeable turn. |

|
| This wireless play crashes to 200 EMA support. |
| Graphic provided by: stockcharts.com. |
| |
| Two bold upside targets are suggested should a tradeable turn develop. The area of $40 - $43 represents an area of previous congestion which could halt the rise of the stock price. Should the stock consolidate here and then gain additional bullish power, a further upside target could take it to the gap resistance area near the $50 level. This very bullish theme may take some time if it does occur. Should the stock falter and dip below the 200-day EMA, then all bullish bets are off. |
Independent Canadian equities trader and technical analyst based in Peterborough
Ontario, Canada.
| Website: | www.whatsonsale.ca/financial.html |
| E-mail address: | gwg7@sympatico.ca |
Click here for more information about our publications!
PRINT THIS ARTICLE

Request Information From Our Sponsors
- StockCharts.com, Inc.
- Candle Patterns
- Candlestick Charting Explained
- Intermarket Technical Analysis
- John Murphy on Chart Analysis
- John Murphy's Chart Pattern Recognition
- John Murphy's Market Message
- MurphyExplainsMarketAnalysis-Intermarket Analysis
- MurphyExplainsMarketAnalysis-Visual Analysis
- StockCharts.com
- Technical Analysis of the Financial Markets
- The Visual Investor
- VectorVest, Inc.
- Executive Premier Workshop
- One-Day Options Course
- OptionsPro
- Retirement Income Workshop
- Sure-Fire Trading Systems (VectorVest, Inc.)
- Trading as a Business Workshop
- VectorVest 7 EOD
- VectorVest 7 RealTime/IntraDay
- VectorVest AutoTester
- VectorVest Educational Services
- VectorVest OnLine
- VectorVest Options Analyzer
- VectorVest ProGraphics v6.0
- VectorVest ProTrader 7
- VectorVest RealTime Derby Tool
- VectorVest Simulator
- VectorVest Variator
- VectorVest Watchdog
