HOT TOPICS LIST
- MACD
- Fibonacci
- RSI
- Gann
- ADXR
- Stochastics
- Volume
- Triangles
- Futures
- Cycles
- Volatility
- ZIGZAG
- MESA
- Retracement
- Aroon
INDICATORS LIST
LIST OF TOPICS
PRINT THIS ARTICLE
by Koos van der Merwe
Everyone knows who Martha Stewart is, and the legal problems she faces. Many investors took a gamble and bought shares of her company, Martha Stewart Living (MSO) when it fell dramatically to a low of $9.32, believing it was oversold. On May 5th the news broke that she would not be allowed another trial. What now for the share price?
Position: Accumulate
Koos van der Merwe
Has been a technical analyst since 1969, and has worked as a futures and options trader with First Financial Futures in Johannesburg, South Africa.
PRINT THIS ARTICLE
HEAD & SHOULDERS
What Now For Martha Stewart Living?
05/10/04 10:02:17 AMby Koos van der Merwe
Everyone knows who Martha Stewart is, and the legal problems she faces. Many investors took a gamble and bought shares of her company, Martha Stewart Living (MSO) when it fell dramatically to a low of $9.32, believing it was oversold. On May 5th the news broke that she would not be allowed another trial. What now for the share price?
Position: Accumulate
| The share IPO'd on October 29, 1999 reaching a high of $50, before closing for the day at $36.87. It then fell to a low of $13.06 by April 8, 2000, before recovering to a high of $34.00 by August 31, 2000. From this date, it fell steadily to a low of $5.26 on October 31, 2002. |

|
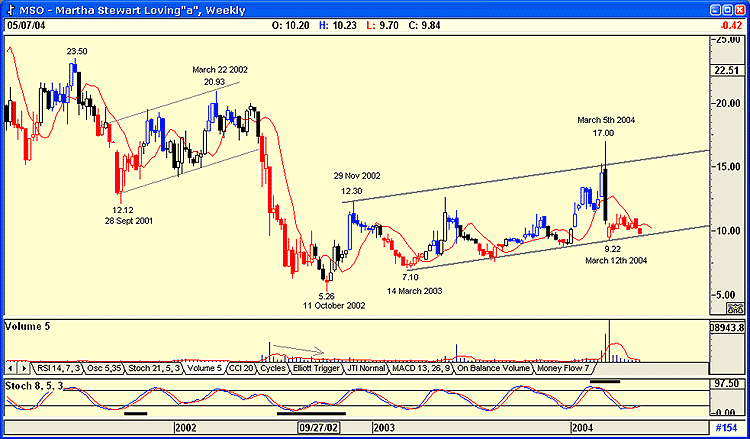
| Figure 1: Weekly chart of Martha Stewart Living. |
| Graphic provided by: AdvancedGET. |
| |
| Above is a weekly chart of Martha Stewart Living showing the downward flag pattern that formed between September 28, 2001 and March 22, 2002. This flag pattern gave a downside target of $9.55 from the upward correction to $23.50 as shown on the chart. (23.50 - 12.12 = 11.38. 20.93 - 11.28 = 9.55). In my calculation I was conservative, as at the time few would have believed that the share price would fall to these depths. The share price reached those depths on October 11th 2002 at $5.26 on falling volume, suggesting strength. From this low, the share price more than doubled by November 29, 2002 at $12.30, before falling once again to $7.10 by March 14, 2003. Since then it has been moving up slowly in a very, very volatile pattern, with a range between $12 and $7, then again $17 and $9 as speculators appear to be trading the share based on the anticipated results of Ms. Stewart's court cases. Two noticeable observations are that volume is below average, and that the stochastic indicator (8,10,3) is suggesting an oversold position. |
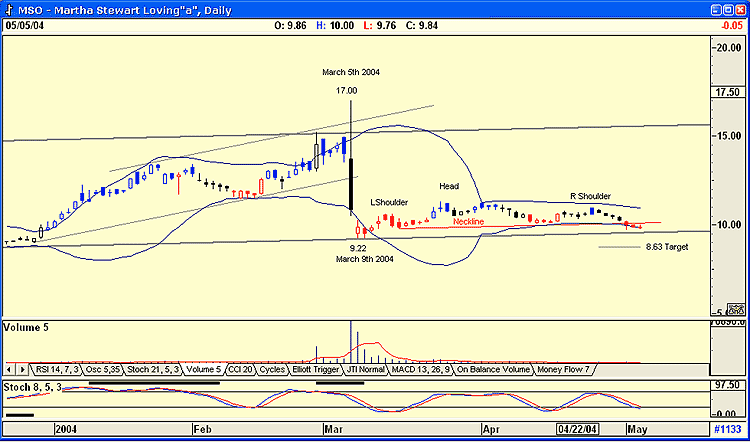
 Figure 2: Daily chart of MSO. The second chart shows the price moving up nicely within two trading bands until March 5, 2004, reaching a high of $17.00. On that day Martha Stewart was found guilty. The share price immediately collapsed to reach the low of $9.22 by March 9, 2004. From that date it appears to have been forming a head and shoulder pattern suggesting a target low of $8.63. The distance from the head to the neckline is 11.25 to 9.94 = 1.31. Subtract 1.31 from the neckline: 9.94 - 1.31 = 8.63. The price has recently broken below the neckline suggesting this is a very real possibility. Volume is extremely low, and the stochastic oscillator is suggesting that an oversold position is in force. As the share price approaches this level, you could consider buying if and when the oscillator gives a buy signal. |
| The chart also shows Bollinger Bands, which have contracted. Bollinger Bands, developed by John Bollinger, follow a number of rules: 1. Sharp moves tend to occur after the bands tighten to the average, indicating that volatility is lessening. 2. A move outside the bands calls for a continuation of the trend. 3. Tops and bottoms made outside the bands followed by tops and bottoms made inside the bands, indicate a trend reversal. 4. A move originating at one band tends to go to the other band. I would therefore look for the bands to expand, and the price to touch the lower band, with the stochastic indicator giving a buy signal before considering a buy. |
Has been a technical analyst since 1969, and has worked as a futures and options trader with First Financial Futures in Johannesburg, South Africa.
| Address: | 3256 West 24th Ave |
| Vancouver, BC | |
| Phone # for sales: | 6042634214 |
| E-mail address: | petroosp@gmail.com |
Click here for more information about our publications!
PRINT THIS ARTICLE

Request Information From Our Sponsors
- StockCharts.com, Inc.
- Candle Patterns
- Candlestick Charting Explained
- Intermarket Technical Analysis
- John Murphy on Chart Analysis
- John Murphy's Chart Pattern Recognition
- John Murphy's Market Message
- MurphyExplainsMarketAnalysis-Intermarket Analysis
- MurphyExplainsMarketAnalysis-Visual Analysis
- StockCharts.com
- Technical Analysis of the Financial Markets
- The Visual Investor
- VectorVest, Inc.
- Executive Premier Workshop
- One-Day Options Course
- OptionsPro
- Retirement Income Workshop
- Sure-Fire Trading Systems (VectorVest, Inc.)
- Trading as a Business Workshop
- VectorVest 7 EOD
- VectorVest 7 RealTime/IntraDay
- VectorVest AutoTester
- VectorVest Educational Services
- VectorVest OnLine
- VectorVest Options Analyzer
- VectorVest ProGraphics v6.0
- VectorVest ProTrader 7
- VectorVest RealTime Derby Tool
- VectorVest Simulator
- VectorVest Variator
- VectorVest Watchdog
