HOT TOPICS LIST
- MACD
- Fibonacci
- RSI
- Gann
- ADXR
- Stochastics
- Volume
- Triangles
- Futures
- Cycles
- Volatility
- ZIGZAG
- MESA
- Retracement
- Aroon
INDICATORS LIST
LIST OF TOPICS
PRINT THIS ARTICLE
by Gary Grosschadl
The Dow has come down 500 points from last February. What's the current outlook?
Position: Hold
Gary Grosschadl
Independent Canadian equities trader and technical analyst based in Peterborough
Ontario, Canada.
PRINT THIS ARTICLE
CHART ANALYSIS
A Look At The Dow
05/04/04 08:13:27 AMby Gary Grosschadl
The Dow has come down 500 points from last February. What's the current outlook?
Position: Hold
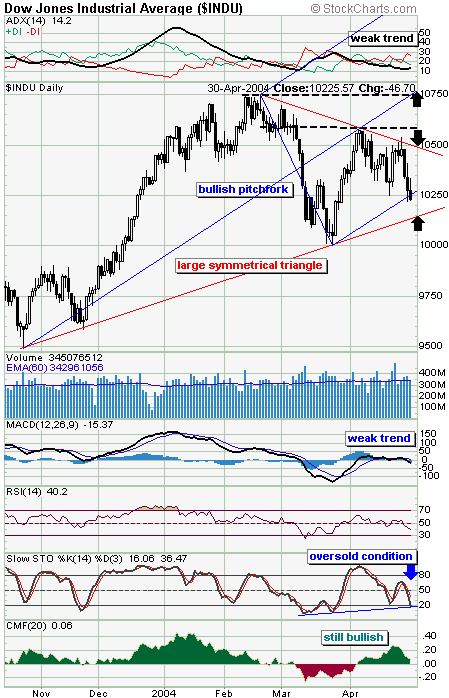
| The daily chart shows two patterns to be considered: A large symmetrical triangle and an Andrews pitchfork. The triangle shows a narrowing formation that will eventually be resolved. This formation is considered a neutral pattern as it can break to either the upside or downside. The pitchfork pattern (Andrews Line) however has a bullish bias, pointing up. |
| The pitchfork shows a classic move to the median (center) line where it reversed to start a downleg. Now the Dow has reached the lower median line for a test. What happens here can be telling -- a bounce off this trendline can initiate an upleg, keeping the bullish bias intact, whereas a move below the pitchfork could signal a bearish trend change for at least a test of the triangle's lower trendline. So what happens next should be closely watched. |

|
| Daily Dow chart shows two formations to consider. |
| Graphic provided by: Stockcharts.com. |
| |
| Looking at the two indicators, a weak trend is evident. The DMI (directional movement indicator) at the top of the chart has three components. The ADX component indicating trend strength, is a rather weak 14.2. Good trend strength has a value of 25 or higher. The MACD (moving average convergence/divergence) also reflects poor trend strength with its sideways drift near the zero line. On a more positive note, the stochastics is now in oversold territory under 20 (%K) which hints at the likelihood of a coming upleg. The CMF (Chaiken Money Flow) indicator is still in a bullish mode, being above zero. This measure of buying and selling power has the supply and demand outlook remaining positive for now. |
| A bullish turn brings several upside targets into play. The upper triangle target near 10,500, a previous high of 10,580, and beyond that the median line target of 10,750 (last February's high). Downside targets include the triangle trendline of 10,150 and then the psychological 10,000 mark. Traders should be prepared for a move either way. I am leaning to a bounce attempt but the market, as always, will have the final say. |
Independent Canadian equities trader and technical analyst based in Peterborough
Ontario, Canada.
| Website: | www.whatsonsale.ca/financial.html |
| E-mail address: | gwg7@sympatico.ca |
Click here for more information about our publications!
Comments
Date: 05/06/04Rank: 5Comment:
Date: 05/11/04Rank: 4Comment:
Date: 05/11/04Rank: 5Comment:

Request Information From Our Sponsors
- VectorVest, Inc.
- Executive Premier Workshop
- One-Day Options Course
- OptionsPro
- Retirement Income Workshop
- Sure-Fire Trading Systems (VectorVest, Inc.)
- Trading as a Business Workshop
- VectorVest 7 EOD
- VectorVest 7 RealTime/IntraDay
- VectorVest AutoTester
- VectorVest Educational Services
- VectorVest OnLine
- VectorVest Options Analyzer
- VectorVest ProGraphics v6.0
- VectorVest ProTrader 7
- VectorVest RealTime Derby Tool
- VectorVest Simulator
- VectorVest Variator
- VectorVest Watchdog
- StockCharts.com, Inc.
- Candle Patterns
- Candlestick Charting Explained
- Intermarket Technical Analysis
- John Murphy on Chart Analysis
- John Murphy's Chart Pattern Recognition
- John Murphy's Market Message
- MurphyExplainsMarketAnalysis-Intermarket Analysis
- MurphyExplainsMarketAnalysis-Visual Analysis
- StockCharts.com
- Technical Analysis of the Financial Markets
- The Visual Investor
