HOT TOPICS LIST
- MACD
- Fibonacci
- RSI
- Gann
- ADXR
- Stochastics
- Volume
- Triangles
- Futures
- Cycles
- Volatility
- ZIGZAG
- MESA
- Retracement
- Aroon
INDICATORS LIST
LIST OF TOPICS
PRINT THIS ARTICLE
by Kevin Hopson
Gold's recent sell signal could actually be a reason to buy.
Position: Hold
Kevin Hopson
Kevin has been a technical analyst for roughly 10 years now. Previously, Kevin owned his own business and acted as a registered investment advisor, specializing in energy. He was also a freelance oil analyst for Orient Trading Co., a commodity futures trading firm in Japan. Kevin is currently a freelance writer.
PRINT THIS ARTICLE
SHAKE-OUTS
Bullish Shakeout Pattern For Gold?
04/30/04 12:49:43 PMby Kevin Hopson
Gold's recent sell signal could actually be a reason to buy.
Position: Hold
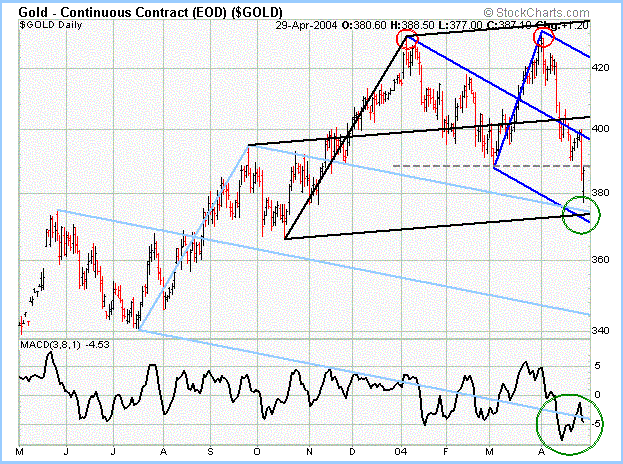
| Most people have the misconception that a breakdown from a double top formation is negative. However, when conditions are right, it can create a great buying opportunity for investors. For example, on the one-year chart for gold, prices formed a double top in early April, as illustrated by the red circles. After topping out around the $430 level, gold prices proceeded to breach support at $390, as illustrated by the dotted gray line. Though this is usually considered a significant sell signal, it can also be a bear trap. |
| The recent price action is also typical of a bullish shakeout pattern. Bullish shakeout patterns occur when prices are in an uptrend, proceed to form a double top and then breach prior support - all the while remaining above their long-term uptrend. When this occurs, the weak hands start running for the exits, creating additional selling pressure and giving the sense that prices are headed much lower. However, once the short-term speculators are out of the market, there are few people left to sell. As a result, buying pressure eventually enters the market, usually pushing prices up to new highs (above the prior double top formation). |

|
| Graphic provided by: Stockcharts.com. |
| |
| Whether this occurs remains to be seen but the downside risk appears to be minimal at current levels. Notice how the bottom dark blue parallel line, the bottom black parallel line and the top light blue parallel line have all converged in the $372 to $375 range. Gold prices came close to testing support here recently but - instead - bounced off the 61.8 percent retracement level ($376) from the July '03 to April '04 rally. As a result, the $372 to $376 range should act as significant support for gold prices. |
| Finally, the moving average convergence divergence (MACD) has been showing bullish divergences on the daily chart, putting in a pattern of higher lows despite the fact that gold prices have been moving lower. This is typical of a bottoming pattern. Coupled with significant support at slightly lower levels, gold could look to rally again soon. |
Kevin has been a technical analyst for roughly 10 years now. Previously, Kevin owned his own business and acted as a registered investment advisor, specializing in energy. He was also a freelance oil analyst for Orient Trading Co., a commodity futures trading firm in Japan. Kevin is currently a freelance writer.
| Glen Allen, VA | |
| E-mail address: | hopson_1@yahoo.com |
Click here for more information about our publications!
Comments
Date: 05/03/04Rank: 4Comment:

Request Information From Our Sponsors
- VectorVest, Inc.
- Executive Premier Workshop
- One-Day Options Course
- OptionsPro
- Retirement Income Workshop
- Sure-Fire Trading Systems (VectorVest, Inc.)
- Trading as a Business Workshop
- VectorVest 7 EOD
- VectorVest 7 RealTime/IntraDay
- VectorVest AutoTester
- VectorVest Educational Services
- VectorVest OnLine
- VectorVest Options Analyzer
- VectorVest ProGraphics v6.0
- VectorVest ProTrader 7
- VectorVest RealTime Derby Tool
- VectorVest Simulator
- VectorVest Variator
- VectorVest Watchdog
- StockCharts.com, Inc.
- Candle Patterns
- Candlestick Charting Explained
- Intermarket Technical Analysis
- John Murphy on Chart Analysis
- John Murphy's Chart Pattern Recognition
- John Murphy's Market Message
- MurphyExplainsMarketAnalysis-Intermarket Analysis
- MurphyExplainsMarketAnalysis-Visual Analysis
- StockCharts.com
- Technical Analysis of the Financial Markets
- The Visual Investor
