HOT TOPICS LIST
- MACD
- Fibonacci
- RSI
- Gann
- ADXR
- Stochastics
- Volume
- Triangles
- Futures
- Cycles
- Volatility
- ZIGZAG
- MESA
- Retracement
- Aroon
INDICATORS LIST
LIST OF TOPICS
PRINT THIS ARTICLE
by Koos van der Merwe
On April 22nd I presented an article "Gann, Elliott and the Dow Revisited." In it I argued that for the long-term, the trend is bearish, but for the short-term it could be bullish. Here is a chart of the S&P 100 Index that looks bullish for the immediate short-term.
Position: N/A
Koos van der Merwe
Has been a technical analyst since 1969, and has worked as a futures and options trader with First Financial Futures in Johannesburg, South Africa.
PRINT THIS ARTICLE
ELLIOTT WAVE
A Daily Chart Of The S&P 100 Index
04/29/04 12:58:40 PMby Koos van der Merwe
On April 22nd I presented an article "Gann, Elliott and the Dow Revisited." In it I argued that for the long-term, the trend is bearish, but for the short-term it could be bullish. Here is a chart of the S&P 100 Index that looks bullish for the immediate short-term.
Position: N/A

|
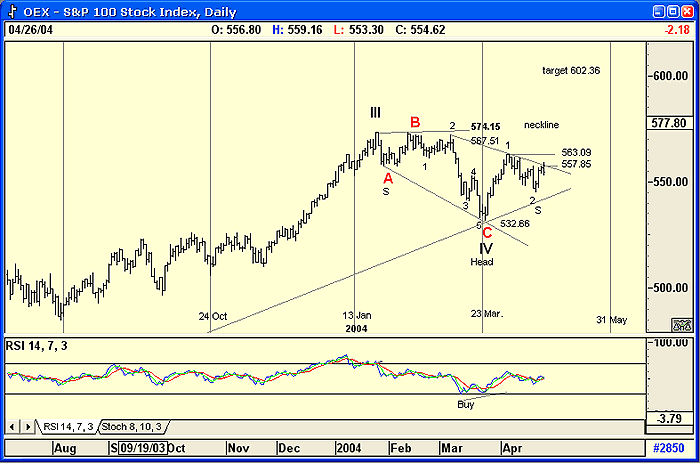
| Figure 1: A possible wave count for the S&P 100 Index. |
| Graphic provided by: AdvancedGET. |
| |
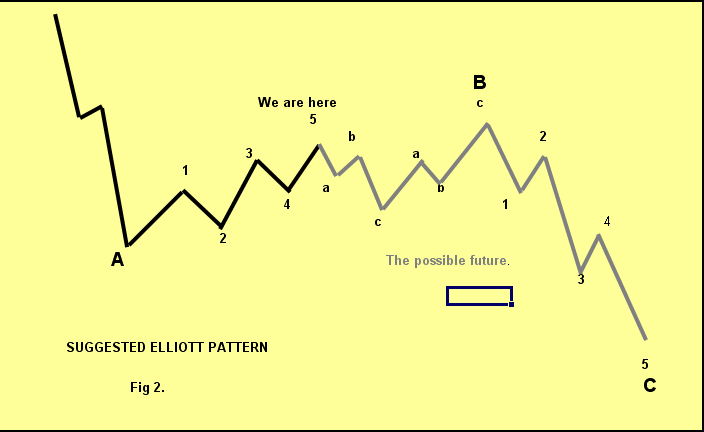
| The chart suggests the following. 1. That it is tracing a Wave IV of a B-Wave upwards. The Wave I and Wave II are the period from December 6, 2002 to March 14, 2003, as shown in the chart of the article "Gann, Elliott and the Dow Revisited." The argument can be made that a B-Wave is not and cannot be an impulse wave, but should follow an ABCXABC upward pattern. This is usually the case, but in my years of charting, I have seen the first and even the last leg of an abc pattern in a rising B wave trace an impulse wave upward. This usually suggests a B-Wave that can equal or rise above the previous Wave V. 2. The 4th Wave shown on the chart appears to be developing an inverse head and shoulders pattern. On the chart I have shown the IV as the head, and the small 12' as the right shoulder. I have chosen "A" as the left shoulder, but it could also be "1." Whichever is correct, the neckline remains the same, and suggests that a breakout above 557.85 could be extremely bullish with a target of 602.36 (567.51 - 532.66 = 34.85 + 567.51 = 602.36). 3. A break above 557.85 and a further break above 563.09 would be very bullish for the short-term, and bring the target of 602 well within our sights. Of course, a move above 574.15, the Wave III top would mean that our Wave count is very correct, and that 602 could be the Wave V top. This would then suggest that Wave V would be the completion of Wave A of WAVE B with a three wave abc down to complete Wave B of WAVE B and a three wave abc up to complete WAVE B. All this sounds very complicated, and for this reason I have attached a chart, "Suggested Elliott Pattern" below to show how the trend could look. (Figure 2). 4. The RSI indicator gave a divergence buy signal and is still rising, suggesting the index should move upwards. |
 Figure 2: Suggested Elliott pattern. As with any Elliott Wave chart, nothing is cast in stone, and any and every Elliotician will have an alternate strategy should the current strategy not develop. Here is one suggestion which could very well be true, and at the moment is my suggestion of choice. |
Has been a technical analyst since 1969, and has worked as a futures and options trader with First Financial Futures in Johannesburg, South Africa.
| Address: | 3256 West 24th Ave |
| Vancouver, BC | |
| Phone # for sales: | 6042634214 |
| E-mail address: | petroosp@gmail.com |
Click here for more information about our publications!
Comments
Date: 04/29/04Rank: 5Comment:

Request Information From Our Sponsors
- StockCharts.com, Inc.
- Candle Patterns
- Candlestick Charting Explained
- Intermarket Technical Analysis
- John Murphy on Chart Analysis
- John Murphy's Chart Pattern Recognition
- John Murphy's Market Message
- MurphyExplainsMarketAnalysis-Intermarket Analysis
- MurphyExplainsMarketAnalysis-Visual Analysis
- StockCharts.com
- Technical Analysis of the Financial Markets
- The Visual Investor
- VectorVest, Inc.
- Executive Premier Workshop
- One-Day Options Course
- OptionsPro
- Retirement Income Workshop
- Sure-Fire Trading Systems (VectorVest, Inc.)
- Trading as a Business Workshop
- VectorVest 7 EOD
- VectorVest 7 RealTime/IntraDay
- VectorVest AutoTester
- VectorVest Educational Services
- VectorVest OnLine
- VectorVest Options Analyzer
- VectorVest ProGraphics v6.0
- VectorVest ProTrader 7
- VectorVest RealTime Derby Tool
- VectorVest Simulator
- VectorVest Variator
- VectorVest Watchdog
