HOT TOPICS LIST
- MACD
- Fibonacci
- RSI
- Gann
- ADXR
- Stochastics
- Volume
- Triangles
- Futures
- Cycles
- Volatility
- ZIGZAG
- MESA
- Retracement
- Aroon
INDICATORS LIST
LIST OF TOPICS
PRINT THIS ARTICLE
by Luis Ferro
Bollinger Bands are highly flexible instruments and can be used in the forecasting of different aspects of market behavior.
Position: Buy
Luis Ferro
Trader and technical analyst living in Bern, Switzerland. A full member of the STA, currently enrolled in the DITA program and the CMT program.
PRINT THIS ARTICLE
BOLLINGER BANDS
Applying Bollinger Bands To Albertson's Inc.
04/29/04 12:56:18 PMby Luis Ferro
Bollinger Bands are highly flexible instruments and can be used in the forecasting of different aspects of market behavior.
Position: Buy
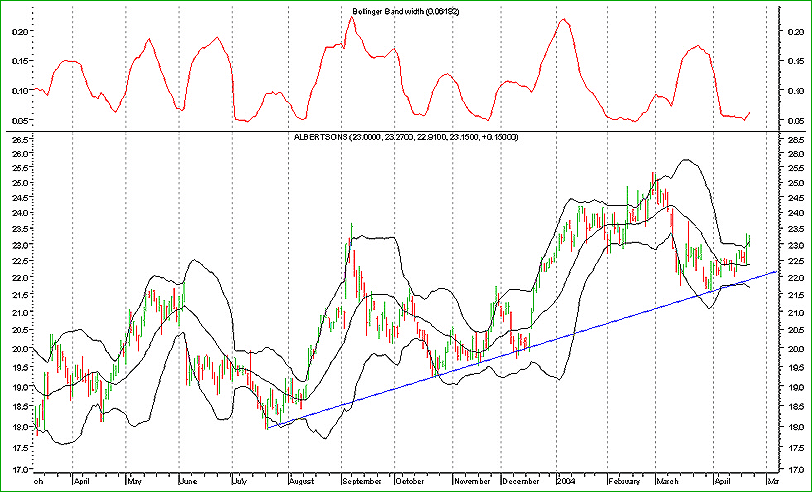
| Bollinger Bands are envelopes in which the upper and lower bands are placed at the distance of two standard deviations apart from the central line. The central line is normally a 20-period simple moving average. Standard deviations are a measure of volatility and this way of defining the envelope width makes the bands elastic, expanding when price movements are larger and contracting when volatility diminishes. |

|
| Figure 1: Albertson's daily chart. |
| Graphic provided by: MetaStock. |
| |
| In this daily chart displaying Albertson's with Bollinger Bands, an indicator showing the width of the bands was plotted in the upper part of the chart. With this indicator it is easier to see the regularity with which the bands contract and expand. Volatility is often highly cyclical, varying from periods of high to low volatility and vice-versa in a rhythmic way. When the width of the Bollinger Bands is at a very low level, as in the case of Albertson's, it can be assumed that volatility is likely to rise to higher levels in the near-term and therefore a strong price movement is about to take place. This property of Bollinger Bands can be used to predict strong price movements, but it does not tell anything about the probable direction of the movement. |
| In trying to forecast the direction of Albertson's next move, another Bollinger Band technique can be used. After touching the upper trendline, ABS immediately started to rise and in the process surpassed the upper Bollinger Band, which is an indication that the price movement is likely to continue. |
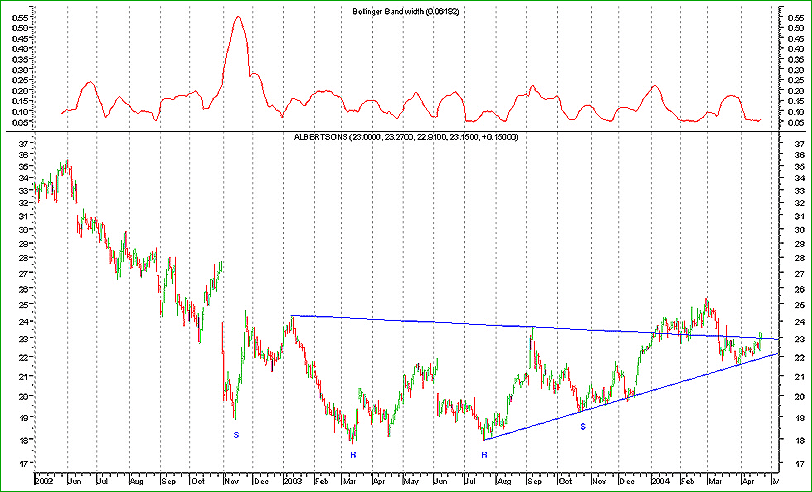
 Figure 2: Albertson's two-year daily chart. In a longer-term chart, a complex inverted head and shoulders pattern can be seen. This complex head and shoulders has two heads instead of one, but it is just as reliable, and its formation forecasts higher prices. The price has shown some hesitation around the neckline, but recently closed above it. The occurence of this pattern gives a lot of strength to the buying signal from the Bollinger Band and a rise in Albertson's is therefore highly probable. This example illustrates the multi-functional character of Bollinger Bands, either in detecting potential strong price movements as well as in forecasting the direction of these movements, especially when combined with other technical methods such as chart patterns. |
Trader and technical analyst living in Bern, Switzerland. A full member of the STA, currently enrolled in the DITA program and the CMT program.
| Address: | Switzerland |
| E-mail address: | luispgsf@yahoo.com |
Click here for more information about our publications!
Comments
Date: 04/29/04Rank: 5Comment:

Request Information From Our Sponsors
- StockCharts.com, Inc.
- Candle Patterns
- Candlestick Charting Explained
- Intermarket Technical Analysis
- John Murphy on Chart Analysis
- John Murphy's Chart Pattern Recognition
- John Murphy's Market Message
- MurphyExplainsMarketAnalysis-Intermarket Analysis
- MurphyExplainsMarketAnalysis-Visual Analysis
- StockCharts.com
- Technical Analysis of the Financial Markets
- The Visual Investor
- VectorVest, Inc.
- Executive Premier Workshop
- One-Day Options Course
- OptionsPro
- Retirement Income Workshop
- Sure-Fire Trading Systems (VectorVest, Inc.)
- Trading as a Business Workshop
- VectorVest 7 EOD
- VectorVest 7 RealTime/IntraDay
- VectorVest AutoTester
- VectorVest Educational Services
- VectorVest OnLine
- VectorVest Options Analyzer
- VectorVest ProGraphics v6.0
- VectorVest ProTrader 7
- VectorVest RealTime Derby Tool
- VectorVest Simulator
- VectorVest Variator
- VectorVest Watchdog
