HOT TOPICS LIST
- MACD
- Fibonacci
- RSI
- Gann
- ADXR
- Stochastics
- Volume
- Triangles
- Futures
- Cycles
- Volatility
- ZIGZAG
- MESA
- Retracement
- Aroon
INDICATORS LIST
LIST OF TOPICS
PRINT THIS ARTICLE
by Ashwani Gujral
The U.S. Dollar is perhaps the instrument most directly affecteted by an actual hike or indications of a hike in U.S. interest rates. The U.S. Dollar Index Futures chart is showing that traders expect a hike in interest rates soon.
Position: N/A
Ashwani Gujral
He is founder of AGIP Securities Pvt. Ltd. which offers money management services, live chat rooms (during market hours) and independent technical analysis consultancy. The company has a big media presence from the likes of CNBC, NDTV Profit, and ZEE Business.
PRINT THIS ARTICLE
ASCENDING TRIANGLES
A Triangle On The U.S. Dollar Index Futures: Will It Flatter Or Deceive?
04/30/04 09:01:27 AMby Ashwani Gujral
The U.S. Dollar is perhaps the instrument most directly affecteted by an actual hike or indications of a hike in U.S. interest rates. The U.S. Dollar Index Futures chart is showing that traders expect a hike in interest rates soon.
Position: N/A
| Charts often show the discounting nature of the markets -- where smart traders start moving their money in anticipation of news. Even though Mr Greenspan may just have hinted at an interest rate hike, the U.S. Dollar has already started breaking out of a bottoming formation. Well, are the smart and informed traders always right? No, but when they are right, they win big. And when they are wrong, they have stop-losses in place and they take their losses and go home just like the rest of us. The key is to follow the smart money as it is not often wrong. An ascending triangle bottom made after a long decline is often just the shifting of lower tops and lower bottoms to higher tops and higher bottoms. And that is more than enough to indicate a trend reversal. Whether or not Greenspan is going to raise rates or when he is going to do so is conjecture, but whenever the first rate hike is announced, the U.S. dollar will have moved up enough to discount the news. If the rate hike story fizzles out, the bottoming pattern will most likely break down and end up looking like a consolidation pattern in a downtrend. The U.S. Dollar Index will then resume its downtrend, otherwise it will keep rising until the news is finally out. In this article, I will look the strength of the traders' reaction to an interest rate hike through the chart action of the U.S. Dollar Index Futures. |

|
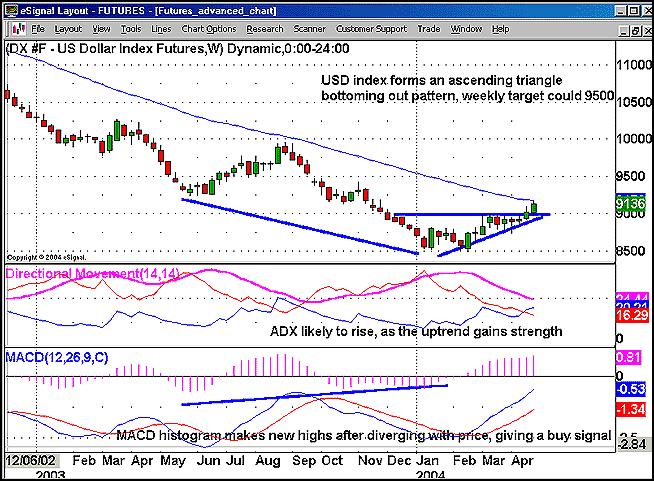
| Figure 1: Weekly chart of the U.S. Dollar Index. |
| Graphic provided by: eSignal. |
| |
| On the weekly chart, the U.S. Dollar Index is forming an ascending triangle bottoming pattern. This pattern consists of an upward sloping line and a horizontal line. The upward sloping line is a trendline connecting higher bottoms, and the flat line is the breakout line for the price pattern. Prices often rally to an approximate target equivalent to the width of the triangle but this minimum target is likely to be exceeded. From a low of 8500 to the flat line at 9000, the width of the triangle is 500 points. Hence a target of 9500 seems likely on a weekly basis. At these targets, traders should tighten their stops as there could be corrections and even reversals at these sites. The trend can be entered again after a correction. If the market does not correct at these resistance points, the same trade can be carried on. The weekly ADX has declined from extreme levels, indicating consolidation. It is likely to move up as the trend gains strength. Now one of the strongest signals in technical analysis is the divergence of the MACD histogram with price. This signal was given when the U.S. Dollar Index reached its low. This adds reliability to this bottoming formation. |
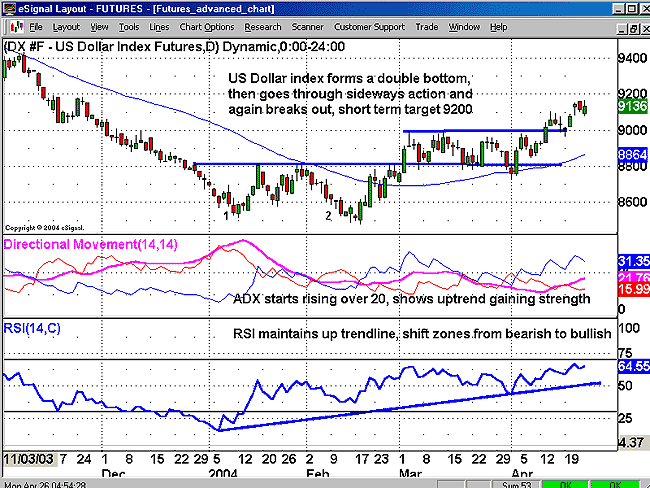
 Figure 2: Daily chart of the U.S. Dollar Index. On the daily chart, the U.S. Dollar Index first traced a double bottom, then moved sideways, and finally broke out upwards. This showed an accumulation was happening at lower levels. The daily ADX, which was below 20 as the U.S. Dollar Index was consolidating, has now moved above the 20 level, indicating a trending move. The RSI is now shifting from the bearish to bullish zone as higher levels are holding. A trendline can be drawn connecting the rising bottoms of the RSI. Until this trendline holds, the trend can be assumed to be healthy. A short-term target of 9200 is calculated by assuming that the sideways consolidation occurred in the middle of the uptrend. |
| The easiest way to enter and identify trends remains the age old higher top and higher bottom, or lower top and lower bottom theory. Traders should remain alert whenever the news is not out and positions are being built in anticipation. If the news does not happen or circumstances change, the entire move may reverse, so at all times place stop-losses at significant lows for protection. |
He is founder of AGIP Securities Pvt. Ltd. which offers money management services, live chat rooms (during market hours) and independent technical analysis consultancy. The company has a big media presence from the likes of CNBC, NDTV Profit, and ZEE Business.
| Title: | Chief mkt strategist |
| Company: | AGIP Securities |
| India | |
| Phone # for sales: | 9871066337 |
| Website: | www.ashwanigujral.com |
| E-mail address: | contact@ashwanigujral.com |
Traders' Resource Links | |
| AGIP Securities has not added any product or service information to TRADERS' RESOURCE. | |
Click here for more information about our publications!
Comments

Request Information From Our Sponsors
- StockCharts.com, Inc.
- Candle Patterns
- Candlestick Charting Explained
- Intermarket Technical Analysis
- John Murphy on Chart Analysis
- John Murphy's Chart Pattern Recognition
- John Murphy's Market Message
- MurphyExplainsMarketAnalysis-Intermarket Analysis
- MurphyExplainsMarketAnalysis-Visual Analysis
- StockCharts.com
- Technical Analysis of the Financial Markets
- The Visual Investor
- VectorVest, Inc.
- Executive Premier Workshop
- One-Day Options Course
- OptionsPro
- Retirement Income Workshop
- Sure-Fire Trading Systems (VectorVest, Inc.)
- Trading as a Business Workshop
- VectorVest 7 EOD
- VectorVest 7 RealTime/IntraDay
- VectorVest AutoTester
- VectorVest Educational Services
- VectorVest OnLine
- VectorVest Options Analyzer
- VectorVest ProGraphics v6.0
- VectorVest ProTrader 7
- VectorVest RealTime Derby Tool
- VectorVest Simulator
- VectorVest Variator
- VectorVest Watchdog
