HOT TOPICS LIST
- MACD
- Fibonacci
- RSI
- Gann
- ADXR
- Stochastics
- Volume
- Triangles
- Futures
- Cycles
- Volatility
- ZIGZAG
- MESA
- Retracement
- Aroon
INDICATORS LIST
LIST OF TOPICS
PRINT THIS ARTICLE
by Ashwani Gujral
Words from Alan Greenspan can often make or break a market. Silver has again proven this to be the case. Silver leads the commodity tailspin. But were there warnings of this crash?
Position: N/A
Ashwani Gujral
He is founder of AGIP Securities Pvt. Ltd. which offers money management services, live chat rooms (during market hours) and independent technical analysis consultancy. The company has a big media presence from the likes of CNBC, NDTV Profit, and ZEE Business.
PRINT THIS ARTICLE
CHART ANALYSIS
Silver Breaks Down After A Vertical Rally
04/27/04 10:59:11 AMby Ashwani Gujral
Words from Alan Greenspan can often make or break a market. Silver has again proven this to be the case. Silver leads the commodity tailspin. But were there warnings of this crash?
Position: N/A
| I last discussed silver in March 2004 ("Are Silver Futures Overheated?" Traders.com Advantage, 03/25/2004). The reasons for my cautious call at that time were the extreme levels of the ADX and the nearly vertical rise of silver. I had also given a target of about 8000, which was exceeded by a small margin. Whenever any chart shows a vertical rise or a drop, you should become extremely cautious. Often it is too good to be true. In such cases, it pays to book profits while they are available and then wait for the breakdown. Although silver did not show any topping out pattern, all its indicators were in extremely overbought territory. The strategy then can be to either use a trailing stop-loss or look to meet a technical target and book profits. Even if you did not want to book profits, the use of a trailing stop-loss would have been desirable. And certainly new buying should have been resisted. |
| That said, the outlook for all commodities has become cloudy since Greenspan hinted at interest rate hikes coming this year. While some commodities like silver have been butchered, others are on the verge of a breakdown. This means you should keep watch for a potential short position in commodities, say if they make a lower top and break down from their sideways ranges. These commodities have come up a long way and I see them going back down a fair way. Commodities are by their very nature cyclical, and bearishness in commodities is accompanied by bullishness in the U.S. dollar. Commodites often rise when interest rates drop. As an economy recovers, commodity industries are the first to move, and their rise is often sharp and swift. This happened in 1999-2000 when commodities were at their lows and the interest rate cycle had peaked out. Similarly, commodities are at their highest when interest rates bottom out and crash as smart traders see that interest rate hikes are coming and withdraw from commodities and move into dollar assets. |

|
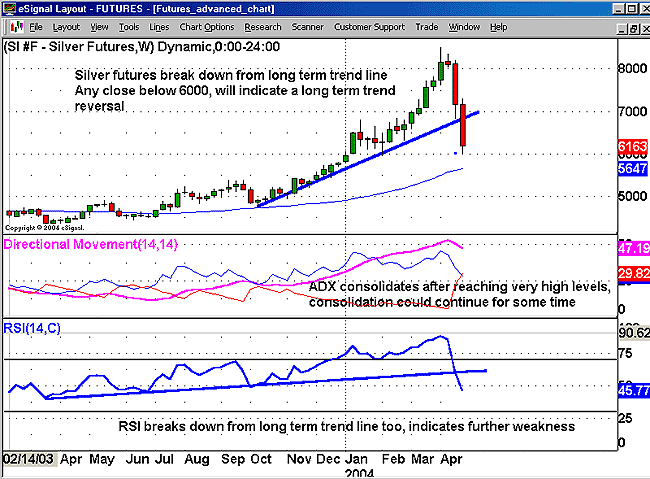
| Figure 1: Weekly chart of silver futures. |
| Graphic provided by: eSignal. |
| |
| On the weekly chart, silver futures have given back in two weeks what took them 13 weeks to gain. This is not a good sign and it is likely to break the back of the weak longs (the strong hands have probably booked profits). Candlesticks often provide advance signals. And in this case, an "evening star" formed. I would have tightened stops as soon as the weekly doji appearred. Confirmation at such overbought levels may not be necessary as the trade can be reentered if the price starts making new highs. With the levels over 45, an extreme consolidation is possible at any time. These consolidations can often be very painful, as you can see that about 25% of the price was lost. The RSI, which was maintaining the weekly uptrend line, has also broken through the line and the previous lower bottom, indicating further weakness. |
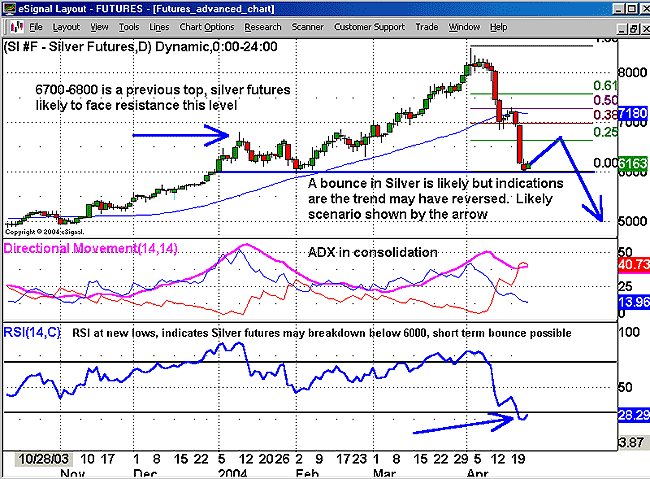
 Figure 2: Daily chart of silver futures. On the daily chart, silver should reach its major support at 6000 in about two weeks, which makes it overbought for the short-term and there may be a bounce from here before the next fall. As this bounce exhausts itself, look to go short, except in the unlikely event that the bounce crosses the previous high. This bounce is likely to end near the 6700-6800 level, which is a previous top and then silver futures are expected to break through the 6000 level. You should remember that, while this scenario is likely, it might not occur. So, short positions should actually be taken only after the 6000 level is broken. The daily ADX has declined from extreme levels and indicates consolidation, which may take some time as a lot of distance to the downside has been covered within a short period. So price action in the coming days will be crucial in determining the next move. The RSI has gone below the 20 level and indicates an extreme oversold condition, which is likely to be corrected. As a next step, look for a lower top as further confirmation of a changing trend. |
| In conclusion, you should remember vertical moves often occur at the end of trends and a lot of caution should be exercised with existing positions and intended new positions. While a bottoming out pattern often takes time to form, tops can take much less time to develop and the fall could be fairly swift, as prices fall under their own weight as well as from panic selling and stop-losses. |
He is founder of AGIP Securities Pvt. Ltd. which offers money management services, live chat rooms (during market hours) and independent technical analysis consultancy. The company has a big media presence from the likes of CNBC, NDTV Profit, and ZEE Business.
| Title: | Chief mkt strategist |
| Company: | AGIP Securities |
| India | |
| Phone # for sales: | 9871066337 |
| Website: | www.ashwanigujral.com |
| E-mail address: | contact@ashwanigujral.com |
Traders' Resource Links | |
| AGIP Securities has not added any product or service information to TRADERS' RESOURCE. | |
Click here for more information about our publications!
Comments
Date: 04/27/04Rank: 5Comment:
Date: 05/06/04Rank: 5Comment:

|

Request Information From Our Sponsors
- VectorVest, Inc.
- Executive Premier Workshop
- One-Day Options Course
- OptionsPro
- Retirement Income Workshop
- Sure-Fire Trading Systems (VectorVest, Inc.)
- Trading as a Business Workshop
- VectorVest 7 EOD
- VectorVest 7 RealTime/IntraDay
- VectorVest AutoTester
- VectorVest Educational Services
- VectorVest OnLine
- VectorVest Options Analyzer
- VectorVest ProGraphics v6.0
- VectorVest ProTrader 7
- VectorVest RealTime Derby Tool
- VectorVest Simulator
- VectorVest Variator
- VectorVest Watchdog
- StockCharts.com, Inc.
- Candle Patterns
- Candlestick Charting Explained
- Intermarket Technical Analysis
- John Murphy on Chart Analysis
- John Murphy's Chart Pattern Recognition
- John Murphy's Market Message
- MurphyExplainsMarketAnalysis-Intermarket Analysis
- MurphyExplainsMarketAnalysis-Visual Analysis
- StockCharts.com
- Technical Analysis of the Financial Markets
- The Visual Investor
