HOT TOPICS LIST
- MACD
- Fibonacci
- RSI
- Gann
- ADXR
- Stochastics
- Volume
- Triangles
- Futures
- Cycles
- Volatility
- ZIGZAG
- MESA
- Retracement
- Aroon
INDICATORS LIST
LIST OF TOPICS
PRINT THIS ARTICLE
by Ashwani Gujral
Except in extraordinary cases, tops and bottoms take time to form. This is because large traders and investors tend to distribute their holdings to retail traders just when these retail traders expect prices to hit new highs again.
Position: N/A
Ashwani Gujral
He is founder of AGIP Securities Pvt. Ltd. which offers money management services, live chat rooms (during market hours) and independent technical analysis consultancy. The company has a big media presence from the likes of CNBC, NDTV Profit, and ZEE Business.
PRINT THIS ARTICLE
CHART ANALYSIS
Gold Moves Sideways, May Be Distributing
04/26/04 12:05:43 PMby Ashwani Gujral
Except in extraordinary cases, tops and bottoms take time to form. This is because large traders and investors tend to distribute their holdings to retail traders just when these retail traders expect prices to hit new highs again.
Position: N/A
| When a stock or commodity is trading in a range, it may be either accumulating, distributing or consolidating. Often it is only clear which one it is in retrospect. Accumulation occurs when a stock or a commodity moves in a range (or forms a pattern) after a huge decline. At this point large investors are buying large quantities at low prices. In this condition, bullish divergences are observed on the indicators. |
| Distribution occurs when a sideways range forms after a strong rally. During distribution, bearish divergences are observed on the indicators. A consolidation formation occurs when a stock pauses for some time, absorbing the gains or losses of the previous rally or decline respectively, before continuing in the direction of the previous trend. However, traders should remember that actual signals for trading occur only on a breakout or breakdown from the range. This should preferably occur with heavy volume to increase confidence. |

|
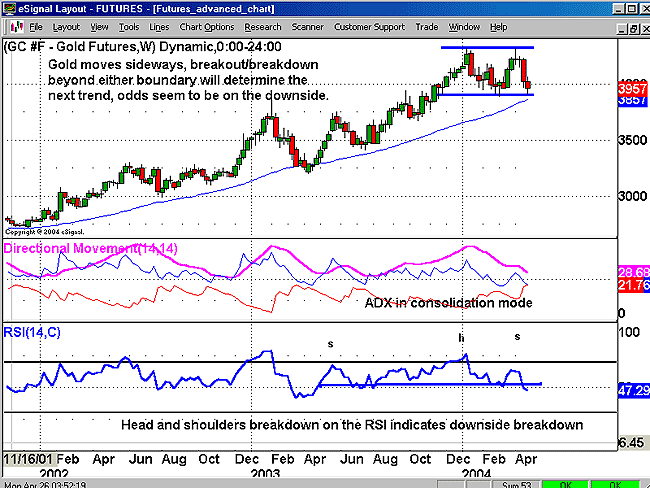
| Figure 1: Weekly chart of gold futures. |
| Graphic provided by: eSignal. |
| |
| The weekly chart shows gold moving sideways in a 40 point range. Considering the carnage the other commodities have gone through, traders should have a bearish bias towards the chart. Although it is possible for gold to remain stronger than the other precious metals, it is unlikely that it can move in the opposite direction. In any event, the next trend in gold will be determined by the breakout or breakdown from its sideways range. The weekly ADX has declined from extremely high levels and is indicating more consolidation, while the weekly RSI is showing a bearish divergence with the price and has also broken down from a bearish head and shoulder pattern. Breakdowns in indicators often lead the price, so a breakdown in gold should be expected, but not preempted. The target on the breakdown could be $350. |
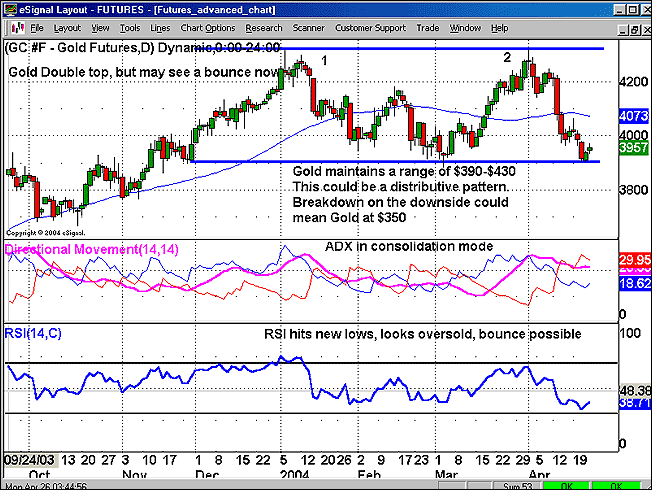
 Figure 2: Daily chart of gold futures. |
| On the daily chart, a double top has formed. But instead of breaking down, it seems to have found support. A short-term bounce may be likely as the RSI is at extremely oversold levels. Short trades should be considered only after the chart shows a decisive breakdown. A daily ADX showing consolidation also leaves the possibility of a bounce open. In fact, the bounce will indicate the direction of the next move in case it fails to reach the previous high. Short positions can be taken once the double top breaks down below $390 on good volume. So traders would be well advised to watch for a trend reversal in gold before considering further postions, and that, although there is a serious weakness in the trend, action should only be taken when key levels are broken. |
He is founder of AGIP Securities Pvt. Ltd. which offers money management services, live chat rooms (during market hours) and independent technical analysis consultancy. The company has a big media presence from the likes of CNBC, NDTV Profit, and ZEE Business.
| Title: | Chief mkt strategist |
| Company: | AGIP Securities |
| India | |
| Phone # for sales: | 9871066337 |
| Website: | www.ashwanigujral.com |
| E-mail address: | contact@ashwanigujral.com |
Traders' Resource Links | |
| AGIP Securities has not added any product or service information to TRADERS' RESOURCE. | |
Click here for more information about our publications!
Comments
Date: 04/26/04Rank: 5Comment:
Date: 04/27/04Rank: 5Comment:

Request Information From Our Sponsors
- StockCharts.com, Inc.
- Candle Patterns
- Candlestick Charting Explained
- Intermarket Technical Analysis
- John Murphy on Chart Analysis
- John Murphy's Chart Pattern Recognition
- John Murphy's Market Message
- MurphyExplainsMarketAnalysis-Intermarket Analysis
- MurphyExplainsMarketAnalysis-Visual Analysis
- StockCharts.com
- Technical Analysis of the Financial Markets
- The Visual Investor
- VectorVest, Inc.
- Executive Premier Workshop
- One-Day Options Course
- OptionsPro
- Retirement Income Workshop
- Sure-Fire Trading Systems (VectorVest, Inc.)
- Trading as a Business Workshop
- VectorVest 7 EOD
- VectorVest 7 RealTime/IntraDay
- VectorVest AutoTester
- VectorVest Educational Services
- VectorVest OnLine
- VectorVest Options Analyzer
- VectorVest ProGraphics v6.0
- VectorVest ProTrader 7
- VectorVest RealTime Derby Tool
- VectorVest Simulator
- VectorVest Variator
- VectorVest Watchdog
