HOT TOPICS LIST
- MACD
- Fibonacci
- RSI
- Gann
- ADXR
- Stochastics
- Volume
- Triangles
- Futures
- Cycles
- Volatility
- ZIGZAG
- MESA
- Retracement
- Aroon
INDICATORS LIST
LIST OF TOPICS
PRINT THIS ARTICLE
by Kevin Hopson
Newmont Mining has rebounded off of this month's lows but will likely make one final move to the downside before the short-term downtrend reverses.
Position: N/A
Kevin Hopson
Kevin has been a technical analyst for roughly 10 years now. Previously, Kevin owned his own business and acted as a registered investment advisor, specializing in energy. He was also a freelance oil analyst for Orient Trading Co., a commodity futures trading firm in Japan. Kevin is currently a freelance writer.
PRINT THIS ARTICLE
TECHNICAL ANALYSIS
A Short-Term Bear Rally For Newmont Mining?
04/26/04 02:44:18 PMby Kevin Hopson
Newmont Mining has rebounded off of this month's lows but will likely make one final move to the downside before the short-term downtrend reverses.
Position: N/A
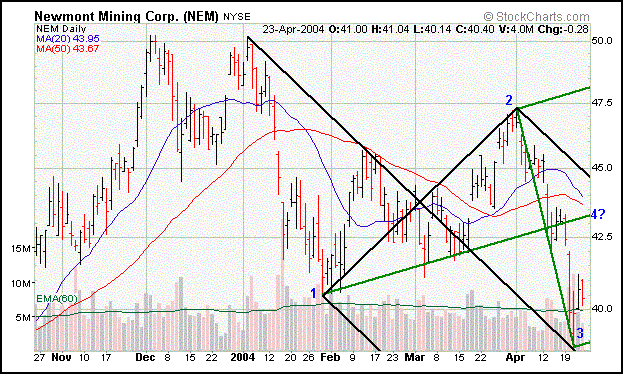
| Newmont Mining Corp. (NEM) has been stuck in a short-term downtrend since topping out early this year. The six-month chart below shows that Newmont formed a double top - just above the $50.00 level - in early January. Since then, the stock has put in a pattern of lower highs and lower lows, which is typical of a downtrend. Now that prices have started to rebound off of this month's lows, the key question is whether or not the stock has put in a significant bottom. If the wave count is any indication, the answer is no. |
| I have touched on wave counts several times before but for those of you new to the idea, I will go over it again. Trends tend to occur in waves of five, consisting of three legs in the direction of the trend and two legs against the trend. As you can see in the chart, Newmont appears to be in the fourth wave of its current downtrend. The stock has seen two legs to the downside and now looks to be in its second leg up. Since the median line of the black pitchfork accurately predicted this month's bottom (end of wave three), the median line of the green pitchfork should accurately predict the completion point for the current leg up (wave four). |

|
| Graphic provided by: Stockcharts.com. |
| |
| The green median line is currently converging in the $43.00 to $43.50 range. This happens to be the site of the 38.2 percent retracement level from the January to April decline, as well as the 50 percent retracement level from this month's decline. Throw in the stock's 20- and 50-day moving averages, which are moving down and converging in this area, and you are looking at significant resistance in the $43.00 to $43.50 range. This helps support my theory that the green median line will act as a turning point for the stock. |
| As a result, I would continue to hold shares of Newmont Mining for the time being but look to lighten up on a test of resistance around the $43.00 level. If the wave count holds true, Newmont should see one final move (wave five) to the downside that would likely take out the recent lows in the process. This would be the time to buy, as the downtrend would be completed. As of right now, it is difficult to predict where this bottom will occur. However, once the fourth wave is completed, it will be easier to confirm this. I will provide an update when and if this occurs. |
Kevin has been a technical analyst for roughly 10 years now. Previously, Kevin owned his own business and acted as a registered investment advisor, specializing in energy. He was also a freelance oil analyst for Orient Trading Co., a commodity futures trading firm in Japan. Kevin is currently a freelance writer.
| Glen Allen, VA | |
| E-mail address: | hopson_1@yahoo.com |
Click here for more information about our publications!
PRINT THIS ARTICLE

Request Information From Our Sponsors
- StockCharts.com, Inc.
- Candle Patterns
- Candlestick Charting Explained
- Intermarket Technical Analysis
- John Murphy on Chart Analysis
- John Murphy's Chart Pattern Recognition
- John Murphy's Market Message
- MurphyExplainsMarketAnalysis-Intermarket Analysis
- MurphyExplainsMarketAnalysis-Visual Analysis
- StockCharts.com
- Technical Analysis of the Financial Markets
- The Visual Investor
- VectorVest, Inc.
- Executive Premier Workshop
- One-Day Options Course
- OptionsPro
- Retirement Income Workshop
- Sure-Fire Trading Systems (VectorVest, Inc.)
- Trading as a Business Workshop
- VectorVest 7 EOD
- VectorVest 7 RealTime/IntraDay
- VectorVest AutoTester
- VectorVest Educational Services
- VectorVest OnLine
- VectorVest Options Analyzer
- VectorVest ProGraphics v6.0
- VectorVest ProTrader 7
- VectorVest RealTime Derby Tool
- VectorVest Simulator
- VectorVest Variator
- VectorVest Watchdog
