HOT TOPICS LIST
- MACD
- Fibonacci
- RSI
- Gann
- ADXR
- Stochastics
- Volume
- Triangles
- Futures
- Cycles
- Volatility
- ZIGZAG
- MESA
- Retracement
- Aroon
INDICATORS LIST
LIST OF TOPICS
PRINT THIS ARTICLE
by Jason K. Hutson
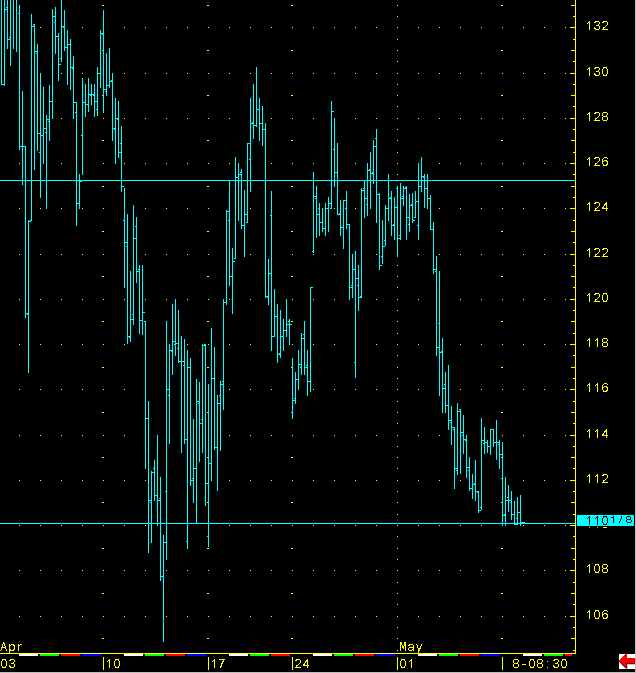
Looking at 60-minute data for Apple Computer, Inc. (AAPL) shows that the past month and a half have been a volatile period. Exhaustive selling during the middle of April created short-term support at $109 per share. By looking at these past support areas, a trader can pick entry points into the market while minimizing risk.
Position: Buy
Jason K. Hutson
Traders.com Staff Writer. Enjoys trendlines, support and resistance, moving averages, RSI, MACD, ADX, Bollinger bands, parabolic SAR, chart formations, and volume analysis.
PRINT THIS ARTICLE
CHANNEL LINES
Minimize Risk By Trading Within A Range
05/09/00 12:24:42 PMby Jason K. Hutson
Looking at 60-minute data for Apple Computer, Inc. (AAPL) shows that the past month and a half have been a volatile period. Exhaustive selling during the middle of April created short-term support at $109 per share. By looking at these past support areas, a trader can pick entry points into the market while minimizing risk.
Position: Buy
| To make better trading decisions, a trader must keep tabs on the market as a whole. To get a feel for the market's direction a trader needs to check certain indices to confirm long-term trends. Several common indices used for market analysis are the Dow Jones Industrial Average, Dow Jones Transports Average, Dow Jones Utilities Average, Nasdaq, and Standard & Poors 500. Analysis of the 50-day moving averages for each of the above indices will give you an idea of the general direction of the trend. A positive-sloping moving average for any of the indices gives you an assurance that the previous trends will continue. |
| After determining that the overall market is trending upwards, a trader must select their securities, and identify possible entry and exit points before any trade is placed. An example of how to use this strategy can be seen in the chart of Apple Computer, Inc. (AAPL). AAPL is currently in a trading range with short-term support at $109 and resistance at around $126. |

|
| AAPL as of 5/8/00 60 Min Bar Charts |
| Graphic provided by: CQG. |
| |
| You have two options under this scenario: 1. LONG. Place a buy order slightly above the first suport level at $110. Place a stop half a point below this level. Exit your position when prices are approaching the resistance line. 2. SHORT. Enter short positions at the resistance level. Place a stop half a point above this level. Cover your short positions as prices approach the support level. |
Traders.com Staff Writer. Enjoys trendlines, support and resistance, moving averages, RSI, MACD, ADX, Bollinger bands, parabolic SAR, chart formations, and volume analysis.
| Title: | Industrial Engineer |
| Company: | Technical Analysis, Inc. |
| Address: | 4757 California Ave SW |
| Seattle, WA 98116 | |
| Phone # for sales: | 206 938 0570 |
| Website: | Traders.com |
| E-mail address: | JasonHutson@Traders.com |
Traders' Resource Links | |
| Charting the Stock Market: The Wyckoff Method -- Books | |
| Working-Money.com -- Online Trading Services | |
| Traders.com Advantage -- Online Trading Services | |
| Technical Analysis of Stocks & Commodities -- Publications and Newsletters | |
| Working Money, at Working-Money.com -- Publications and Newsletters | |
| Traders.com Advantage -- Publications and Newsletters | |
| Professional Traders Starter Kit -- Software | |
Click here for more information about our publications!
Comments

|

Request Information From Our Sponsors
- StockCharts.com, Inc.
- Candle Patterns
- Candlestick Charting Explained
- Intermarket Technical Analysis
- John Murphy on Chart Analysis
- John Murphy's Chart Pattern Recognition
- John Murphy's Market Message
- MurphyExplainsMarketAnalysis-Intermarket Analysis
- MurphyExplainsMarketAnalysis-Visual Analysis
- StockCharts.com
- Technical Analysis of the Financial Markets
- The Visual Investor
- VectorVest, Inc.
- Executive Premier Workshop
- One-Day Options Course
- OptionsPro
- Retirement Income Workshop
- Sure-Fire Trading Systems (VectorVest, Inc.)
- Trading as a Business Workshop
- VectorVest 7 EOD
- VectorVest 7 RealTime/IntraDay
- VectorVest AutoTester
- VectorVest Educational Services
- VectorVest OnLine
- VectorVest Options Analyzer
- VectorVest ProGraphics v6.0
- VectorVest ProTrader 7
- VectorVest RealTime Derby Tool
- VectorVest Simulator
- VectorVest Variator
- VectorVest Watchdog
