HOT TOPICS LIST
- MACD
- Fibonacci
- RSI
- Gann
- ADXR
- Stochastics
- Volume
- Triangles
- Futures
- Cycles
- Volatility
- ZIGZAG
- MESA
- Retracement
- Aroon
INDICATORS LIST
LIST OF TOPICS
PRINT THIS ARTICLE
by Kevin Hopson
Ford Motor Co. has spiked higher in recent days but the rally may not be over yet.
Position: Hold
Kevin Hopson
Kevin has been a technical analyst for roughly 10 years now. Previously, Kevin owned his own business and acted as a registered investment advisor, specializing in energy. He was also a freelance oil analyst for Orient Trading Co., a commodity futures trading firm in Japan. Kevin is currently a freelance writer.
PRINT THIS ARTICLE
TECHNICAL ANALYSIS
Ford Motor Co. Approaching Key Resistance
04/23/04 10:16:58 AMby Kevin Hopson
Ford Motor Co. has spiked higher in recent days but the rally may not be over yet.
Position: Hold
| I have touched on Ford Motor Co. (F) a couple of times since March. In doing so, I have stressed the likelihood of a significant upside breakout for the stock, as bullish divergences on the chart and extremely pessimistic market sentiment both indicated such a move. After reporting blow-out earnings for the first quarter of 2004 this past Wednesday, Ford has seen its stock price spike higher. So the question is, what should we do next? |
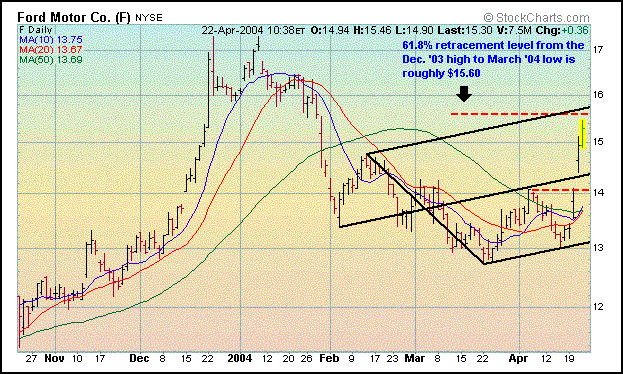
| Looking at the six-month chart for Ford, you will notice that the stock is coming up on key resistance in the $15.60 to $15.80 range. This is the site of the 61.8 percent retracement level from the Dec. '03 to March '04 decline, as well as the top parallel line of the black pitchfork. If Ford can overcome resistance here, the stock should eventually test its 52-week high above the $17.00 level. |

|
| Graphic provided by: Stockcharts.com. |
| |
| Even if Ford fails to break resistance here in the near-term, I would remain bullish on the stock, the primary reason being that market sentiment continues to be pessimistic. More specifically, short interest increased from 87.37M shares on February 8 to 90.49M shares on April 7. Though this is not a huge increase, the short interest ratio (almost 9.0x normal daily volume) is so high that it indicates a lot of potential buying pressure. Additionally, despite recent upgrades (post-earnings announcement), the majority of analysts still have hold or sell ratings on the stock. |
| I would continue to hold shares of Ford Motor Co. and look to add on a significant pullback -- the $14.10 to $14.40 range appears to be a good buying point. Not only is this the site of Wednesday's gap higher (double top breakout), but it is also the site of the black median line, which Ford recently moved above. It will likely take some time for the stock to pull back to these levels (assuming it does), which should allow the shorter-term moving averages to catch up. |
Kevin has been a technical analyst for roughly 10 years now. Previously, Kevin owned his own business and acted as a registered investment advisor, specializing in energy. He was also a freelance oil analyst for Orient Trading Co., a commodity futures trading firm in Japan. Kevin is currently a freelance writer.
| Glen Allen, VA | |
| E-mail address: | hopson_1@yahoo.com |
Click here for more information about our publications!
PRINT THIS ARTICLE

Request Information From Our Sponsors
- VectorVest, Inc.
- Executive Premier Workshop
- One-Day Options Course
- OptionsPro
- Retirement Income Workshop
- Sure-Fire Trading Systems (VectorVest, Inc.)
- Trading as a Business Workshop
- VectorVest 7 EOD
- VectorVest 7 RealTime/IntraDay
- VectorVest AutoTester
- VectorVest Educational Services
- VectorVest OnLine
- VectorVest Options Analyzer
- VectorVest ProGraphics v6.0
- VectorVest ProTrader 7
- VectorVest RealTime Derby Tool
- VectorVest Simulator
- VectorVest Variator
- VectorVest Watchdog
- StockCharts.com, Inc.
- Candle Patterns
- Candlestick Charting Explained
- Intermarket Technical Analysis
- John Murphy on Chart Analysis
- John Murphy's Chart Pattern Recognition
- John Murphy's Market Message
- MurphyExplainsMarketAnalysis-Intermarket Analysis
- MurphyExplainsMarketAnalysis-Visual Analysis
- StockCharts.com
- Technical Analysis of the Financial Markets
- The Visual Investor
