HOT TOPICS LIST
- MACD
- Fibonacci
- RSI
- Gann
- ADXR
- Stochastics
- Volume
- Triangles
- Futures
- Cycles
- Volatility
- ZIGZAG
- MESA
- Retracement
- Aroon
INDICATORS LIST
LIST OF TOPICS
PRINT THIS ARTICLE
by David Penn
An early April symmetrical triangle in silver futures produced a vertigo-inducing collapse by mid-month.
Position: N/A
David Penn
Technical Writer for Technical Analysis of STOCKS & COMMODITIES magazine, Working-Money.com, and Traders.com Advantage.
PRINT THIS ARTICLE
SYMMETRICAL TRIANGLE
Silver's Slippery Symmetrical Triangle
04/22/04 08:03:23 AMby David Penn
An early April symmetrical triangle in silver futures produced a vertigo-inducing collapse by mid-month.
Position: N/A
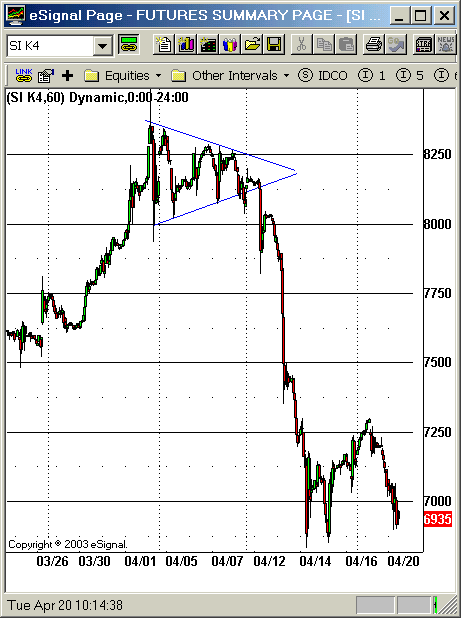
| When I first showed this symmetrical triangle to a colleague, she was a bit skeptical. I don't recall whether it was the intraday nature of the pattern that gave pause, or the intrahour price extremes at the beginning of the formation. But, at first glance the symmetrical triangle that developed in May silver between April 2nd and April 8th didn't have too many bearish takers. Or bullish ones, for that matter. |
| This was with good reason. Symmetrical triangles, as I have suggested in articles for both Traders.com Advantage and Working-Money.com, tend to be non-directional patterns. Unlike other chart patterns, such as head and shoulders, flags, double tops and double bottoms, symmetrical triangles give few (if any) clues as to whether the breakout from the pattern will be to the upside or to the downside. Symmetrical triangles can be tops or bottoms, or merely continuation patterns -- serving as an area of accumulation and distribution for the next leg up (or down). |

|
| Figure 1: A dizzying descent from this symmetrical triangle. Prices reached the downside minimum objective, bounced, and then went on to even lower lows. |
| Graphic provided by: eSignal. |
| |
| While there were some clues that pointed to a downside break from this symmetrical triangle (namely the depth of MACDH troughs from April 2nd to the 8th compared to the height of MACDH peaks), often the best guide to handling these triangles is to wait for the breakout. That was certainly the case with May silver. |
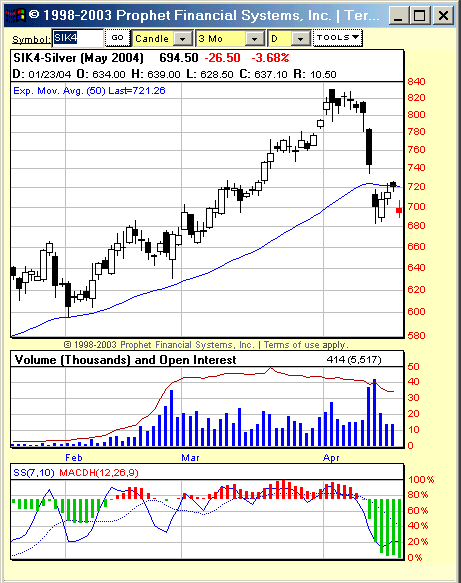
 Figure 2: If the April lows are taken out, then a continued correction in May silver could see the March lows surpassed as well. As with a previous symmetrical triangle I discussed in Traders.com Advantage ("Temporary Triangle Trouble in the Hourly S&P 500," March 3, 2004), the breakdown from this symmetrical triangle was more extreme than expected. Based on a reasonable measurement of the triangle (by "reasonable" I mean eliminating the intrahour price extremes), we get a formation size of about 350 ($3.50). Subtracting this amount from the value at the breakdown (approximately 8185 or $8.185), we get a minimum downside of $7.835. |
| Interestingly, prices fell to approximately $7.820 on their initial descent before bouncing a few cents over $8. But this bounce was only temporary as May silver crashed below the post-breakdown lows, falling by more than a dollar before consolidating (somewhat) between $7.25 and $6.80. A heads up going forward: the same sort of break the hourly May silver futures made on April 12th (when the post-breakdown lows were taken out after a brief pullback) may be setting up on the daily chart of May silver. Although the stochastic reveals these futures to be oversold (as does the exceptionally deep MACDH which, by the way, suggests further lower prices), the break in silver's bull market appears to be quite real. Should May silver take out the current daily lows of $6.83, a swing rule measurement of the likely downside suggests a continued correction to as low as $6.39. |
Technical Writer for Technical Analysis of STOCKS & COMMODITIES magazine, Working-Money.com, and Traders.com Advantage.
| Title: | Technical Writer |
| Company: | Technical Analysis, Inc. |
| Address: | 4757 California Avenue SW |
| Seattle, WA 98116 | |
| Phone # for sales: | 206 938 0570 |
| Fax: | 206 938 1307 |
| Website: | www.Traders.com |
| E-mail address: | DPenn@traders.com |
Traders' Resource Links | |
| Charting the Stock Market: The Wyckoff Method -- Books | |
| Working-Money.com -- Online Trading Services | |
| Traders.com Advantage -- Online Trading Services | |
| Technical Analysis of Stocks & Commodities -- Publications and Newsletters | |
| Working Money, at Working-Money.com -- Publications and Newsletters | |
| Traders.com Advantage -- Publications and Newsletters | |
| Professional Traders Starter Kit -- Software | |
Click here for more information about our publications!
Comments

Request Information From Our Sponsors
- StockCharts.com, Inc.
- Candle Patterns
- Candlestick Charting Explained
- Intermarket Technical Analysis
- John Murphy on Chart Analysis
- John Murphy's Chart Pattern Recognition
- John Murphy's Market Message
- MurphyExplainsMarketAnalysis-Intermarket Analysis
- MurphyExplainsMarketAnalysis-Visual Analysis
- StockCharts.com
- Technical Analysis of the Financial Markets
- The Visual Investor
- VectorVest, Inc.
- Executive Premier Workshop
- One-Day Options Course
- OptionsPro
- Retirement Income Workshop
- Sure-Fire Trading Systems (VectorVest, Inc.)
- Trading as a Business Workshop
- VectorVest 7 EOD
- VectorVest 7 RealTime/IntraDay
- VectorVest AutoTester
- VectorVest Educational Services
- VectorVest OnLine
- VectorVest Options Analyzer
- VectorVest ProGraphics v6.0
- VectorVest ProTrader 7
- VectorVest RealTime Derby Tool
- VectorVest Simulator
- VectorVest Variator
- VectorVest Watchdog
