

HOT TOPICS LIST
- MACD
- Fibonacci
- RSI
- Gann
- ADXR
- Stochastics
- Volume
- Triangles
- Futures
- Cycles
- Volatility
- ZIGZAG
- MESA
- Retracement
- Aroon
INDICATORS LIST
LIST OF TOPICS
PRINT THIS ARTICLE
by Arthur Hill
Apex Silver (SIL) suffered a big setback in mid-April, but the long-term picture is still bullish.
Position: Sell
Arthur Hill
Arthur Hill is currently editor of TDTrader.com, a website specializing in trading strategies, sector/industry specific breadth stats and overall technical analysis. He passed the Society of Technical Analysts (STA London) diploma exam with distinction is a Certified Financial Technician (CFTe). Prior to TD Trader, he was the Chief Technical Analyst for Stockcharts.com and the main contributor to the ChartSchool.
PRINT THIS ARTICLE
Apex Still In Long-Term Uptrend
04/23/04 10:13:29 AMby Arthur Hill
Apex Silver (SIL) suffered a big setback in mid-April, but the long-term picture is still bullish.
Position: Sell
|
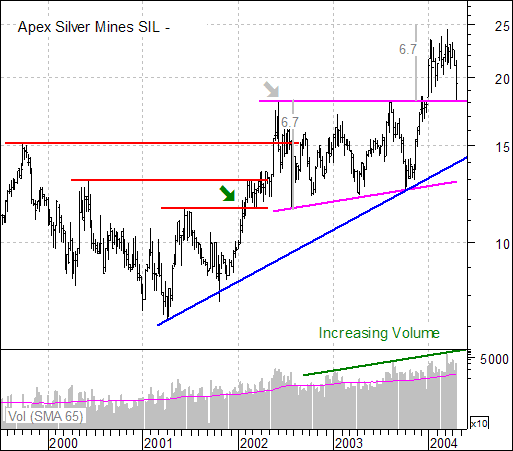
| Figure 1: Weekly chart of Apex Silver Mines. |
| Graphic provided by: MetaStock. |
| |
| On the weekly chart, SIL broke resistance levels at 11.5, 13 and 15.2 with a big move in late 2001 and early 2002. The first breakout recorded a 52-week high in Jan-01 (green arrow) and the stock extended its gains until early Jun-02 (gray arrow). An ascending triangle formed from Jun-02 to Nov-03 (magenta trendlines) and this is a bullish continuation pattern. The early Dec-03 breakout signaled a continuation higher and projected a move to around 25. Also notice that volume has expanded since the third quarter of 2002 as buying pressure increased. |
| Apex Silver Mines reached the target at 25 and broken resistance around 18 became support. This is a basic tenet of technical analysis: broken resistance turns into support. Moreover, a return to broken support (turned resistance) can offer a second chance to partake in an ongoing uptrend. Support around 18 is also confirmed by a 50-62% retracement of the prior advance (12.51 to 24.53), which is a typical retracement for a correction. |
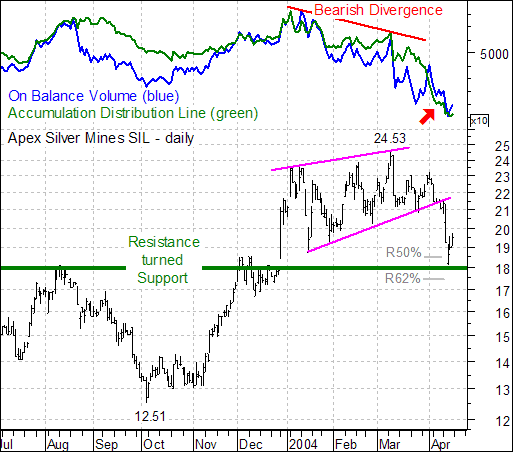 Figure 2: Daily chart of Apex Silver Mines. Even though SIL is at support, two key volume-based indicators shed some light on the recent decline and show that the stock is not out of the woods just yet. Both on-balance volume (OBV) and the accumulation distribution line formed bearish divergences from January to March. While SIL moved to new highs within a rising wedge, OBV and the accumulation distribution line formed lower highs and moved to new reaction lows (red arrow). Prices were moving higher, but these bearish divergences showed distribution that ultimately evolved into outright selling pressure. With new lows recently, OBV and the accumulation distribution line are still in bear mode and a successful support test around 18 should be accompanied by strength in these to volume-based indicators. |
Arthur Hill is currently editor of TDTrader.com, a website specializing in trading strategies, sector/industry specific breadth stats and overall technical analysis. He passed the Society of Technical Analysts (STA London) diploma exam with distinction is a Certified Financial Technician (CFTe). Prior to TD Trader, he was the Chief Technical Analyst for Stockcharts.com and the main contributor to the ChartSchool.
| Title: | Editor |
| Company: | TDTrader.com |
| Address: | Willem Geetsstraat 17 |
| Mechelen, B2800 | |
| Phone # for sales: | 3215345465 |
| Website: | www.tdtrader.com |
| E-mail address: | arthurh@tdtrader.com |
Traders' Resource Links | |
| TDTrader.com has not added any product or service information to TRADERS' RESOURCE. | |
Click here for more information about our publications!
PRINT THIS ARTICLE

Request Information From Our Sponsors
- StockCharts.com, Inc.
- Candle Patterns
- Candlestick Charting Explained
- Intermarket Technical Analysis
- John Murphy on Chart Analysis
- John Murphy's Chart Pattern Recognition
- John Murphy's Market Message
- MurphyExplainsMarketAnalysis-Intermarket Analysis
- MurphyExplainsMarketAnalysis-Visual Analysis
- StockCharts.com
- Technical Analysis of the Financial Markets
- The Visual Investor
- VectorVest, Inc.
- Executive Premier Workshop
- One-Day Options Course
- OptionsPro
- Retirement Income Workshop
- Sure-Fire Trading Systems (VectorVest, Inc.)
- Trading as a Business Workshop
- VectorVest 7 EOD
- VectorVest 7 RealTime/IntraDay
- VectorVest AutoTester
- VectorVest Educational Services
- VectorVest OnLine
- VectorVest Options Analyzer
- VectorVest ProGraphics v6.0
- VectorVest ProTrader 7
- VectorVest RealTime Derby Tool
- VectorVest Simulator
- VectorVest Variator
- VectorVest Watchdog