HOT TOPICS LIST
- MACD
- Fibonacci
- RSI
- Gann
- ADXR
- Stochastics
- Volume
- Triangles
- Futures
- Cycles
- Volatility
- ZIGZAG
- MESA
- Retracement
- Aroon
INDICATORS LIST
LIST OF TOPICS
PRINT THIS ARTICLE
by Kevin Hopson
EnCana's bullish flag breakout and recent pullback to key support levels has provided a great buying opportunity for the stock.
Position: Accumulate
Kevin Hopson
Kevin has been a technical analyst for roughly 10 years now. Previously, Kevin owned his own business and acted as a registered investment advisor, specializing in energy. He was also a freelance oil analyst for Orient Trading Co., a commodity futures trading firm in Japan. Kevin is currently a freelance writer.
PRINT THIS ARTICLE
FLAGS AND PENNANTS
EnCana's Bullish Flag Breakout
04/20/04 10:29:26 AMby Kevin Hopson
EnCana's bullish flag breakout and recent pullback to key support levels has provided a great buying opportunity for the stock.
Position: Accumulate
| EnCana Corp. (ECA) is the largest natural gas producer in North America. The company also has the largest independent natural gas storage network in North America, with 134 billion cubic feet (bcf) of natural gas storage capacity as of December 31, 2003. If that is not enough, EnCana has one of the biggest proved reserve bases among independent oil and gas companies. So, if you are looking for exposure to the currently strong natural gas market, EnCana is one of your best options. |

|
| Graphic provided by: Stockcharts.com. |
| |
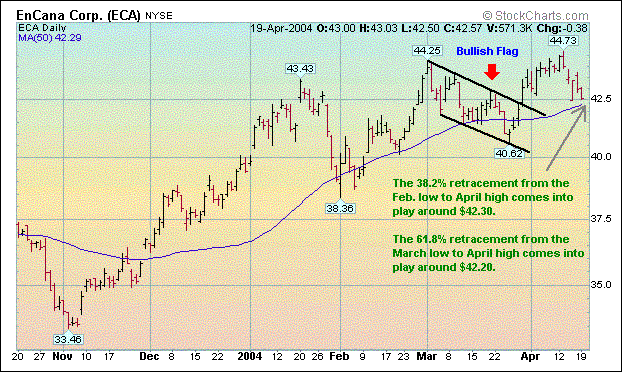
| Technically speaking, the stock broke out of a bullish flag formation late last month, as illustrated in the six-month chart. A bullish flag formation is basically a falling channel after a steep move up. Since bullish flags tend to be continuation patterns, a further move to the upside was likely. Based on last month's breakout, and because bullish flags normally fly "half mast," meaning that these formations tend to occur in the middle of a significant uptrend, it appears that EnCana could eventually make its way up to the $48.00 level. More specifically, if you measure the distance from the February rally ($44.25-$38.36), which led up to the bullish flag formation, you get a distance of roughly $6.00 (or $5.89 to be exact). If you add this figure to the approximate breakout point ($42.00), you come up with a price target of roughly $48.00. |
| Fortunately for longs, EnCana has now pulled back to key support levels, making the risk/reward more favorable. You will notice that EnCana is quickly approaching its 50-day moving average ($42.29), which has acted as ultimate support for the stock the last several months. Additionally, the 38.2 percent retracement level from the February-April rally ($42.30) and the 61.8 percent retracement level from the March-April rally ($42.20) both come into play around the 50-day moving average. Given the confluence of support in the $42.20 to $42.30 range, I would accumulate shares of EnCana Corp. in the near-term. |
Kevin has been a technical analyst for roughly 10 years now. Previously, Kevin owned his own business and acted as a registered investment advisor, specializing in energy. He was also a freelance oil analyst for Orient Trading Co., a commodity futures trading firm in Japan. Kevin is currently a freelance writer.
| Glen Allen, VA | |
| E-mail address: | hopson_1@yahoo.com |
Click here for more information about our publications!
PRINT THIS ARTICLE

Request Information From Our Sponsors
- StockCharts.com, Inc.
- Candle Patterns
- Candlestick Charting Explained
- Intermarket Technical Analysis
- John Murphy on Chart Analysis
- John Murphy's Chart Pattern Recognition
- John Murphy's Market Message
- MurphyExplainsMarketAnalysis-Intermarket Analysis
- MurphyExplainsMarketAnalysis-Visual Analysis
- StockCharts.com
- Technical Analysis of the Financial Markets
- The Visual Investor
- VectorVest, Inc.
- Executive Premier Workshop
- One-Day Options Course
- OptionsPro
- Retirement Income Workshop
- Sure-Fire Trading Systems (VectorVest, Inc.)
- Trading as a Business Workshop
- VectorVest 7 EOD
- VectorVest 7 RealTime/IntraDay
- VectorVest AutoTester
- VectorVest Educational Services
- VectorVest OnLine
- VectorVest Options Analyzer
- VectorVest ProGraphics v6.0
- VectorVest ProTrader 7
- VectorVest RealTime Derby Tool
- VectorVest Simulator
- VectorVest Variator
- VectorVest Watchdog
