HOT TOPICS LIST
- MACD
- Fibonacci
- RSI
- Gann
- ADXR
- Stochastics
- Volume
- Triangles
- Futures
- Cycles
- Volatility
- ZIGZAG
- MESA
- Retracement
- Aroon
INDICATORS LIST
LIST OF TOPICS
PRINT THIS ARTICLE
by Koos van der Merwe
Popular for their predictive power/capacity, Gann and Elliott wave methods reach similar conclusions in their forecasts for the spring of 2004.
Position: Sell
Koos van der Merwe
Has been a technical analyst since 1969, and has worked as a futures and options trader with First Financial Futures in Johannesburg, South Africa.
PRINT THIS ARTICLE
GANN ANGLE
Gann, Elliott And The Dow Revisited
04/22/04 11:58:16 AMby Koos van der Merwe
Popular for their predictive power/capacity, Gann and Elliott wave methods reach similar conclusions in their forecasts for the spring of 2004.
Position: Sell
| On the 18th of March I wrote an article on my interpretation of the Dow's movement after the change in government in Spain, and the threat of a pullout of Spanish troops from Iraq. I concluded the article by saying ". . .the chart is suggesting that the Dow could start rising in a fifth wave up. Dates shown on the chart could be corrections, either highs or lows, as the index moves to new highs. A move above 10425 will confirm the upmove. So, for the short-term, it looks like Al Qaeda is no longer influencing the market and has lost." Today, the order to withdraw the troops has been issued. So, has my forecast changed? See for yourself. |

|
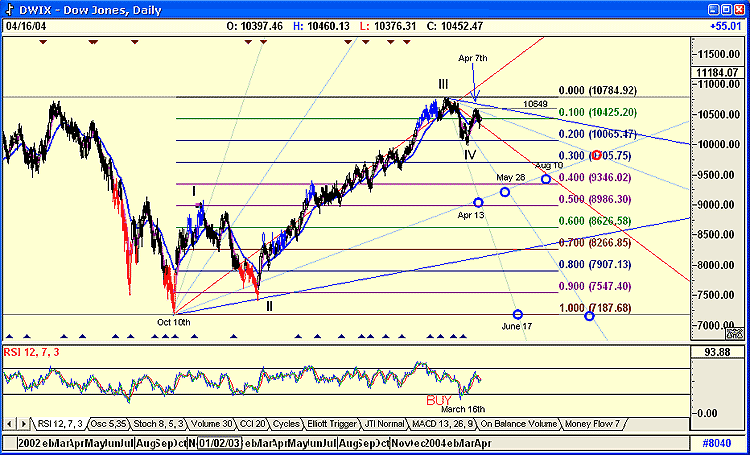
| Figure 1: March 18th daily Gann/Elliot chart of the Dow Jones (DWIX). |
| Graphic provided by: AdvancedGET. |
| |
| This is the identical chart I presented on March 18th, one month ago, showing the Dow's possible movement up to April 16th. In this period, the Dow moved up strongly until April 7th at 10649 before falling back to find support on the Gann 1 x 1 line (red). A Gann crossover of a 1 x 2 with a 1 x 4 for April 13th was not that accurate, a sign that you should only consider Gann crossovers when similar angles in a Gann fan cross each other. The expected turning point, whether up or down for May 28th, would therefore be of importance, as would the suggested turning date of June 17th. This is where the 1 x 4 crosses the horizontal line drawn from the low of October 10th. The RSI indicator, which gave a buy signal on March 16th, is still moving up, suggesting bullishness and that the present correction down is temporary. |
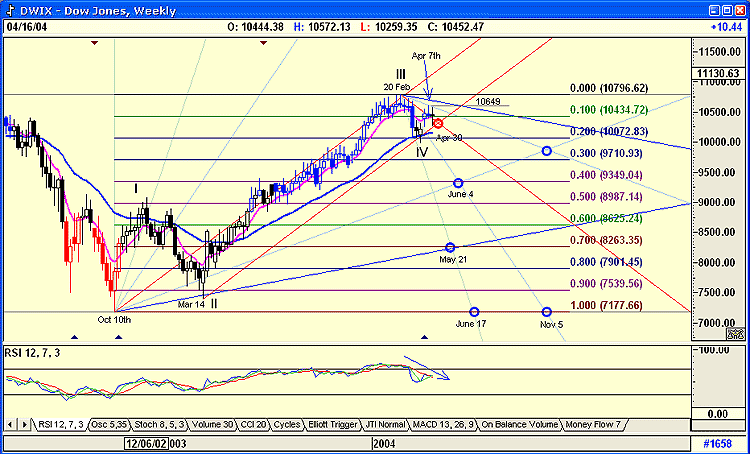
 Figure 2: Updated weekly chart of the Dow. However, Figure 2 shows a different picture. A 1 x 1 drawn from the low of March 14th (Wave II) is showing that the recent retracement is using it as a support level. There is also a suggested turning point on April 30th, and the RSI indicator is suggesting that the overall trend could be down. Note how the weekly Dow found support at 10072 at the 0.20 level and resistance at 10434 at the 0.1 level. These levels are determined by dividing the range from the low of October 10th to the high of February 20th into tenths rather than eight as suggested by Gann, simply because prices on the NYSE are now quoted in decimals and no longer in eighths. I like to see the daily and weekly charts moving in the same direction, and the fact that they differ suggests that Wave IV down is not complete and it could fall to 8987, the top of Wave I. A Wave IV cannot fall below Wave I. If it does, it would mean the count would be an ABC correction rather than an upward five wave impulse wave. Support levels are shown at 9710 and 9349. The possible bottom for Wave IV on the weekly chart is May 21, June 4th, and June 17th, these being Gann fan cross points as shown on the chart. |
| To conclude, I can only suggest that any upward movement in the daily chart of the Dow is a Wave IV correction, and that the long-term move for the Dow is bearish. |
Has been a technical analyst since 1969, and has worked as a futures and options trader with First Financial Futures in Johannesburg, South Africa.
| Address: | 3256 West 24th Ave |
| Vancouver, BC | |
| Phone # for sales: | 6042634214 |
| E-mail address: | petroosp@gmail.com |
Click here for more information about our publications!
Comments
Date: 04/22/04Rank: 5Comment:

Request Information From Our Sponsors
- StockCharts.com, Inc.
- Candle Patterns
- Candlestick Charting Explained
- Intermarket Technical Analysis
- John Murphy on Chart Analysis
- John Murphy's Chart Pattern Recognition
- John Murphy's Market Message
- MurphyExplainsMarketAnalysis-Intermarket Analysis
- MurphyExplainsMarketAnalysis-Visual Analysis
- StockCharts.com
- Technical Analysis of the Financial Markets
- The Visual Investor
- VectorVest, Inc.
- Executive Premier Workshop
- One-Day Options Course
- OptionsPro
- Retirement Income Workshop
- Sure-Fire Trading Systems (VectorVest, Inc.)
- Trading as a Business Workshop
- VectorVest 7 EOD
- VectorVest 7 RealTime/IntraDay
- VectorVest AutoTester
- VectorVest Educational Services
- VectorVest OnLine
- VectorVest Options Analyzer
- VectorVest ProGraphics v6.0
- VectorVest ProTrader 7
- VectorVest RealTime Derby Tool
- VectorVest Simulator
- VectorVest Variator
- VectorVest Watchdog
