HOT TOPICS LIST
- MACD
- Fibonacci
- RSI
- Gann
- ADXR
- Stochastics
- Volume
- Triangles
- Futures
- Cycles
- Volatility
- ZIGZAG
- MESA
- Retracement
- Aroon
INDICATORS LIST
LIST OF TOPICS
PRINT THIS ARTICLE
by Ashwani Gujral
Symmetrical triangles are difficult to trade because they do not give any directional information about their breakouts. But they occur far too frequently for traders to ignore them. In this article, I look at W.W. Grainger's (GWW) symmetrical triangle consolidation pattern that has been forming over the last two years.
Position: N/A
Ashwani Gujral
He is founder of AGIP Securities Pvt. Ltd. which offers money management services, live chat rooms (during market hours) and independent technical analysis consultancy. The company has a big media presence from the likes of CNBC, NDTV Profit, and ZEE Business.
PRINT THIS ARTICLE
SYMMETRICAL TRIANGLE
W.W. Grainger Inc. Breaks Out
04/22/04 11:49:34 AMby Ashwani Gujral
Symmetrical triangles are difficult to trade because they do not give any directional information about their breakouts. But they occur far too frequently for traders to ignore them. In this article, I look at W.W. Grainger's (GWW) symmetrical triangle consolidation pattern that has been forming over the last two years.
Position: N/A
| Symmetrical triangles represent the classic fight between the bulls and the bears, with one side finally prevailing. Although three out of four symmetrical triangles turn out to be continuation patterns, they are known to occur in both reversal and continuation versions. But whether they are reversal or continuation triangles is known only after the fact and by the volume on the breakout. When trading a symmetrical triangle, all breakouts or breakdowns should have significant volume in order to be valid. Symmetrical triangles can occur over long periods of time. A company whose stock is going through this type of consolidation is often trying to find its feet, and analysts are readjusting their expectations of the company's performance. The stock rallies with expectation of improved results and declines when those expectations are not met. Finally, as the weight of expectations is shed from the company, the company now delivers better results, and the stock sees a breakout from the triangle. |
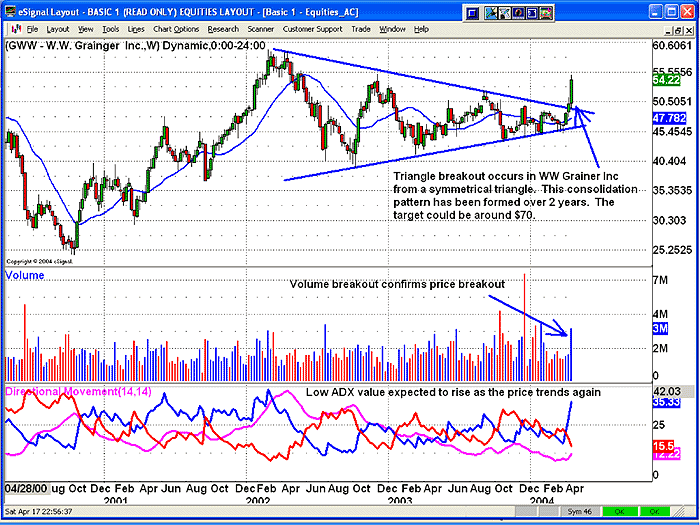
| For example, look at the weekly chart pattern of W.W. Grainger. To begin with, is not an ideal symmetrical triangle; the ideal touches its boundaries only four times before breaking out or down. This is not the case on the W.W. Grainger weekly chart. The pattern here touches its boundaries more than four times. Obviously the price chart doesn't care whether you call its pattern a triangle or sideways consolidation. But we put a framework on in order to give it shape and meaning. So, once you've established a triangle pattern you should look to fulfill the following two conditions: 1. It must break out from the pattern on heavy volume. 2. There should be a confluence of chart action across time frames supporting the breakout. In this case, the names and specific rules of the patterns need to be flexible in order to analyze various situation. Also, as always, do not try to preempt or predict the direction of breakout before it occurs.  Figure 1: Weekly chart of WW Grainger Inc. On the weekly chart of W.W. Grainger there is an upside breakout from a symmetrical triangle. This breakout has occurred on higher volume so this makes it credible. This trendline breakout should be bought only after the market corrects to the trendline, finds support and then rise again. This exercise in caution is necessary because of the overall sideways movement of the market. An approximate target can be calculated by adding the width (about 20 points) of the triangle to the point of breakout (50 + 20), which gives a target of $70. The ADX remains below 20, as the stock had been consolidating for many months and now should be expected to move up if a trending move takes shape. |

|
| Figure 2: Daily chart of W.W. Grainger Inc. |
| Graphic provided by: eSignal. |
| |
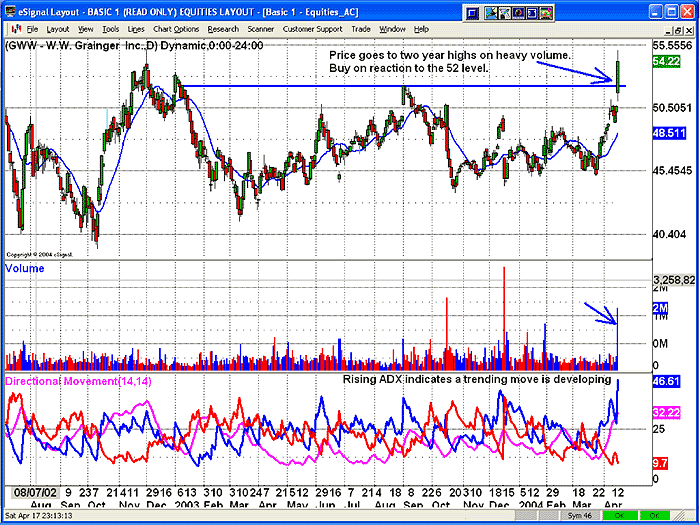
| On the daily chart, prices have broken out to new 52-week highs. In technical analysis, the price is always right and this kind of breakout on heavy volume needs to be respected. This is also confirmed by a weekly trendline breakout. The daily ADX is above 30, which shows the presence of a strong trend. One point of caution -- you have to react differently to breakouts in different types of markets. In a very bullish market, these breakouts can be bought without any problem as follow-through is expected. In sideways markets, it is important to see if such breakouts sustain and to try to buy once there is some kind of profit booking or reaction to a major support, which in this case could be at the $52 level or the breakout level on the daily chart. |
He is founder of AGIP Securities Pvt. Ltd. which offers money management services, live chat rooms (during market hours) and independent technical analysis consultancy. The company has a big media presence from the likes of CNBC, NDTV Profit, and ZEE Business.
| Title: | Chief mkt strategist |
| Company: | AGIP Securities |
| India | |
| Phone # for sales: | 9871066337 |
| Website: | www.ashwanigujral.com |
| E-mail address: | contact@ashwanigujral.com |
Traders' Resource Links | |
| AGIP Securities has not added any product or service information to TRADERS' RESOURCE. | |
Click here for more information about our publications!
PRINT THIS ARTICLE

Request Information From Our Sponsors
- StockCharts.com, Inc.
- Candle Patterns
- Candlestick Charting Explained
- Intermarket Technical Analysis
- John Murphy on Chart Analysis
- John Murphy's Chart Pattern Recognition
- John Murphy's Market Message
- MurphyExplainsMarketAnalysis-Intermarket Analysis
- MurphyExplainsMarketAnalysis-Visual Analysis
- StockCharts.com
- Technical Analysis of the Financial Markets
- The Visual Investor
- VectorVest, Inc.
- Executive Premier Workshop
- One-Day Options Course
- OptionsPro
- Retirement Income Workshop
- Sure-Fire Trading Systems (VectorVest, Inc.)
- Trading as a Business Workshop
- VectorVest 7 EOD
- VectorVest 7 RealTime/IntraDay
- VectorVest AutoTester
- VectorVest Educational Services
- VectorVest OnLine
- VectorVest Options Analyzer
- VectorVest ProGraphics v6.0
- VectorVest ProTrader 7
- VectorVest RealTime Derby Tool
- VectorVest Simulator
- VectorVest Variator
- VectorVest Watchdog
