HOT TOPICS LIST
- MACD
- Fibonacci
- RSI
- Gann
- ADXR
- Stochastics
- Volume
- Triangles
- Futures
- Cycles
- Volatility
- ZIGZAG
- MESA
- Retracement
- Aroon
INDICATORS LIST
LIST OF TOPICS
PRINT THIS ARTICLE
by Ashwani Gujral
Peoplesoft Inc. was forming a head and shoulders pattern on the weekly chart, indicating a bottom formation. But the pattern seems to be failing as prices refuse to cross the neckline.
Position: N/A
Ashwani Gujral
He is founder of AGIP Securities Pvt. Ltd. which offers money management services, live chat rooms (during market hours) and independent technical analysis consultancy. The company has a big media presence from the likes of CNBC, NDTV Profit, and ZEE Business.
PRINT THIS ARTICLE
CHART ANALYSIS
Failure Of A Bottoming Out Pattern In Peoplesoft Inc.
04/22/04 09:22:16 AMby Ashwani Gujral
Peoplesoft Inc. was forming a head and shoulders pattern on the weekly chart, indicating a bottom formation. But the pattern seems to be failing as prices refuse to cross the neckline.
Position: N/A
| Candlesticks are often a better reflection of market supply and demand than bar charts. Using candlesticks can forewarn of upcoming pattern failures as in the case of Peoplesoft Inc. (PSFT). If prices are not likely to cross a certain neckline or a trendline, they show certain patterns warning traders that a breakout may not happen in the near future. Traders are well advised to wait for an actual breakout rather than trading assumed breakouts. Formation such as shooting stars, bearish engulfing, and dojis are some of the candle patterns traders need to watch near trendlines. |
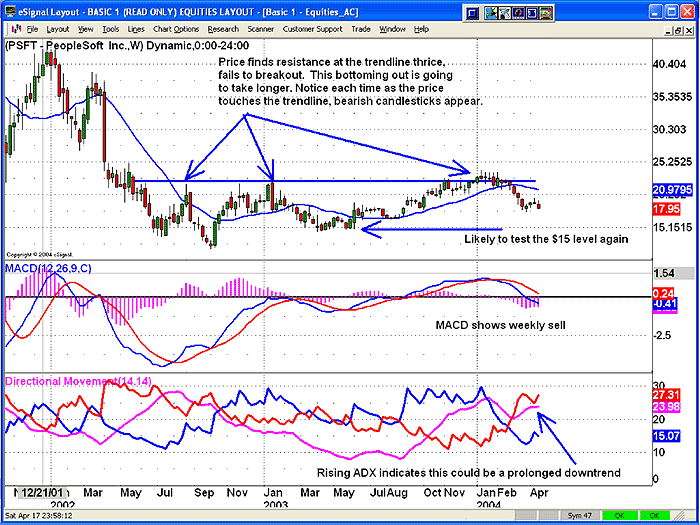
| Here is a brief description of the above candle patterns: Doji: Occurs when the open and the close for the day are the same. It depicts indecision and can often mean impending weakness in an uptrend. Shooting star: Indicates an end to the upmove. A shooting star is characterized by a small real body and a long upper shadow. The body of the shooting star gaps up over the previous day. Bearish engulfing: A two candle pattern occuring in an uptrend. On the first day a small white body occurs. On the next day prices open at new highs and quickly sell off, closing below the open of the previous day.  Figure 1: Weekly chart of Peoplesoft Inc. On the weekly chart, a head and shoulders bottom can be seen. The prices found resistance the first two times the neckline was tested, which was expected. But the upmove from the right shoulder is often quite fast, occuring on heavy volume. Instead, with Peoplesoft, a lot of dojis formed, a number of them right at the neckline. This indicates that this pattern is likely to fail. Remember, many market participants track head and shoulder patterns and will take positions in the anticipation of a breakout. And if the breakout looks like it is going to fail, a potential move in the other direction may set up. This is exactly what is happening with Peoplesoft Inc. The MACD has given a weekly sell signal, the ADX has corrected to about the 20 level and is now rising. This indicates that the downtrend is strengthening and a test of $14.75 level is likely. Now traders should try to enter on any consolidation pattern that may form on the daily chart. |

|
| Figure 2: Daily chart of Peoplesoft. |
| Graphic provided by: eSignal. |
| |
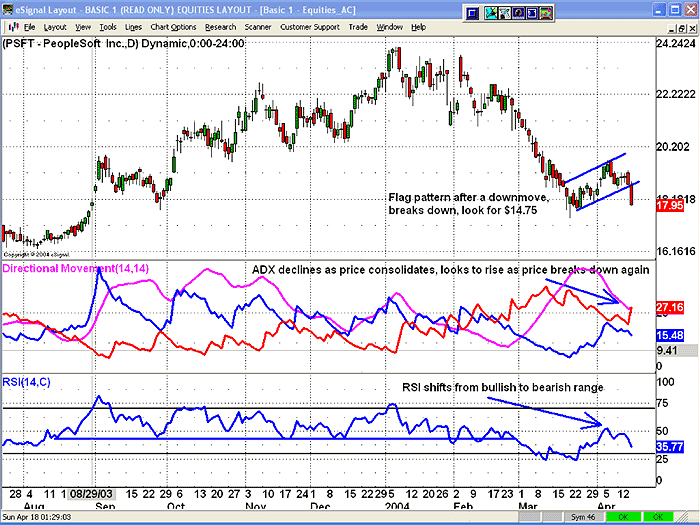
| On the daily chart, there is a sharp down move followed by a flag pattern. This generally indicates a pause in continuing up or down moves, finally breaking out or breaking down in the direction of the original move. A target from the flag breakout can be calculated by extrapolating the move before the flag and adding it to the breakout/breakdown point of the flag. At the same time the RSI, which was finding support consistently at the 50 level, has broken out and is now in a bearish zone. When the RSI is above the 50 level it is in a bullish zone and prices are achieving higher levels. Conversely, it is in a bearish zone when prices are declining consistently and the RSI finds resistance at around the 50 level. The daily ADX will decline as the price goes into a flag formation, and should rise again as prices break down again. Finally, I'd like to emphasize that candlesticks offer much more information than barcharts and traders could take advantage of them to determine if certain support or resistance will hold or break. |
He is founder of AGIP Securities Pvt. Ltd. which offers money management services, live chat rooms (during market hours) and independent technical analysis consultancy. The company has a big media presence from the likes of CNBC, NDTV Profit, and ZEE Business.
| Title: | Chief mkt strategist |
| Company: | AGIP Securities |
| India | |
| Phone # for sales: | 9871066337 |
| Website: | www.ashwanigujral.com |
| E-mail address: | contact@ashwanigujral.com |
Traders' Resource Links | |
| AGIP Securities has not added any product or service information to TRADERS' RESOURCE. | |
Click here for more information about our publications!
Comments
Date: 04/27/04Rank: 4Comment:

Request Information From Our Sponsors
- StockCharts.com, Inc.
- Candle Patterns
- Candlestick Charting Explained
- Intermarket Technical Analysis
- John Murphy on Chart Analysis
- John Murphy's Chart Pattern Recognition
- John Murphy's Market Message
- MurphyExplainsMarketAnalysis-Intermarket Analysis
- MurphyExplainsMarketAnalysis-Visual Analysis
- StockCharts.com
- Technical Analysis of the Financial Markets
- The Visual Investor
- VectorVest, Inc.
- Executive Premier Workshop
- One-Day Options Course
- OptionsPro
- Retirement Income Workshop
- Sure-Fire Trading Systems (VectorVest, Inc.)
- Trading as a Business Workshop
- VectorVest 7 EOD
- VectorVest 7 RealTime/IntraDay
- VectorVest AutoTester
- VectorVest Educational Services
- VectorVest OnLine
- VectorVest Options Analyzer
- VectorVest ProGraphics v6.0
- VectorVest ProTrader 7
- VectorVest RealTime Derby Tool
- VectorVest Simulator
- VectorVest Variator
- VectorVest Watchdog
