HOT TOPICS LIST
- MACD
- Fibonacci
- RSI
- Gann
- ADXR
- Stochastics
- Volume
- Triangles
- Futures
- Cycles
- Volatility
- ZIGZAG
- MESA
- Retracement
- Aroon
INDICATORS LIST
LIST OF TOPICS
PRINT THIS ARTICLE
by Sean Moore
Once you've identified and predicted the current market trend, you must decide whether it's time to enter the market, exit the market, or abstain from the market altogether. Looking at a security's relative strength or weakness in comparison to a composite index can be an effective technical tool used to aid in this decision and help to maximize your profits.
Position: N/A
Sean Moore
Traders.com Staff Writer.
PRINT THIS ARTICLE
STRATEGIES
Wyckoff Part 2: Determining Relative Strength And Weakness
05/08/00 11:15:42 AMby Sean Moore
Once you've identified and predicted the current market trend, you must decide whether it's time to enter the market, exit the market, or abstain from the market altogether. Looking at a security's relative strength or weakness in comparison to a composite index can be an effective technical tool used to aid in this decision and help to maximize your profits.
Position: N/A
| In his search for a successful trading strategy, Richard D. Wyckoff founded his classic stock analysis method, commonly referred to as the Wyckoff method. The second building block of Wyckoff's method states: In a bull (uptrend) market, select from those stocks in harmony with the market- the ones that are stronger than the market itself. In a bear (downtrend) market, select from those stocks in harmony with the market- the ones that are weaker than the market itself. This type of analysis can help the trader identify with a greater certainty an issue or issues that will follow the market trend and yield the greatest profit. If an established trend exists, this step of the Wyckoff method may help to identify the best issues in which to establish a position. |
| A stock that is relatively strong to the market is likely to remain relatively strong unless or until there is enough of a change in the forces of supply and demand to alter the character of the action. The concept of relative strength and weakness is useful in all three types of trends. In an uptrend, the relatively strong stocks represent the best candidates for long positions while the relatively weak stocks represent the worst candidates. In a downtrend the opposite is true, and the relatively weak stocks represent the best candidates. The position of the market within the trading range determines whether the relatively strong stocks or the relatively weak stocks represent the best opportunities. As the market approaches the resistance level at the top of the trading range, the stocks that are relatively weak represent the best opportunities on the short side in anticipation of a move back to the bottom of the trading range. These stocks do not have to be in trading ranges themselves. They are more likely to be in downtrends as a result of their relative weakness. As the market approaches the bottom of the trading range, the relatively strong stocks represent the best opportunities on the long side in anticipation of a move back toward the top of the trading range. These stocks do not have to be in trading ranges; relative strength is likely to have them in uptrends. |

|
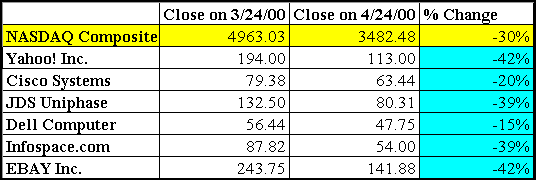
| Figure 1: A few of Nasdaq's issues in comparison with the Nasdaq composite indices for the time period of 3/24/00 - 4/24/00. |
| Graphic provided by: Microsoft Excel. |
| |
| If you look at the Nasdaq Composite Index for the time period between 3/24/00 and 4/24/00, you will notice a strong sell-off in this technology-based index, as the price dips from 4963 down to 3482, nearly a 30% drop! If you calculate the same percentage change for a list of securities from the index, you can identify relatively strong and relatively weak issues. Figure 1 shows a comparison of a few issues traded on the Nasdaq. For this time period and these issues, Dell Computer and Cisco Systems represent relatively strong stocks, while the others are weak in comparison to the index. This type of analysis can be tedious, but it is likely to point you towards issues that have potential for the greatest profit gains. |
Traders.com Staff Writer.
| Title: | Project Engineer |
| Company: | Technical Analysis, Inc. |
| Address: | 4757 California Ave. SW |
| Seattle, WA 98116 | |
| Phone # for sales: | 206 938 0570 |
| Fax: | 206 938 1307 |
| Website: | Traders.com |
| E-mail address: | smoore@traders.com |
Traders' Resource Links | |
| Charting the Stock Market: The Wyckoff Method -- Books | |
| Working-Money.com -- Online Trading Services | |
| Traders.com Advantage -- Online Trading Services | |
| Technical Analysis of Stocks & Commodities -- Publications and Newsletters | |
| Working Money, at Working-Money.com -- Publications and Newsletters | |
| Traders.com Advantage -- Publications and Newsletters | |
| Professional Traders Starter Kit -- Software | |
Click here for more information about our publications!
Comments

Request Information From Our Sponsors
- StockCharts.com, Inc.
- Candle Patterns
- Candlestick Charting Explained
- Intermarket Technical Analysis
- John Murphy on Chart Analysis
- John Murphy's Chart Pattern Recognition
- John Murphy's Market Message
- MurphyExplainsMarketAnalysis-Intermarket Analysis
- MurphyExplainsMarketAnalysis-Visual Analysis
- StockCharts.com
- Technical Analysis of the Financial Markets
- The Visual Investor
- VectorVest, Inc.
- Executive Premier Workshop
- One-Day Options Course
- OptionsPro
- Retirement Income Workshop
- Sure-Fire Trading Systems (VectorVest, Inc.)
- Trading as a Business Workshop
- VectorVest 7 EOD
- VectorVest 7 RealTime/IntraDay
- VectorVest AutoTester
- VectorVest Educational Services
- VectorVest OnLine
- VectorVest Options Analyzer
- VectorVest ProGraphics v6.0
- VectorVest ProTrader 7
- VectorVest RealTime Derby Tool
- VectorVest Simulator
- VectorVest Variator
- VectorVest Watchdog
